

Өзекті паттерндер

Тройное дно
сформирован 01.04 в 20:26:17 (UTC+0)
сила сигнала 1 из 5
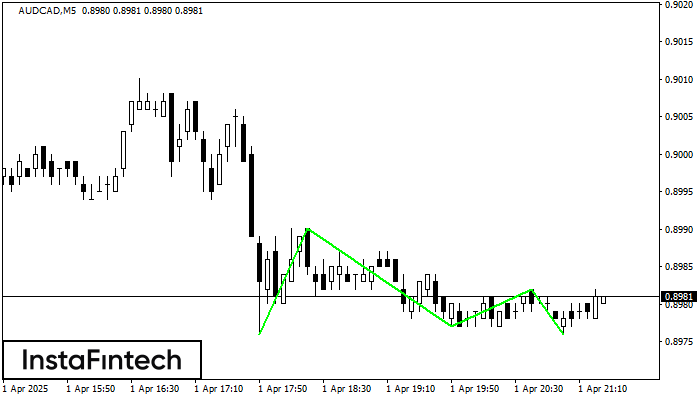
Сформирована фигура «Тройное дно» по торговому инструменту AUDCAD на M5. Фигура сигнализирует об изменении тенденции с нисходящей на восходящую в случае пробоя верхней границы 0.8982.
Таймфреймы М5 и М15 могут иметь больше ложных точек входа.
Сондай-ақ қараңыз
- Все
- Все
- Bearish Rectangle
- Bearish Symmetrical Triangle
- Bearish Symmetrical Triangle
- Bullish Rectangle
- Double Top
- Double Top
- Triple Bottom
- Triple Bottom
- Triple Top
- Triple Top
- Все
- Все
- Покупка
- Продажа
- Все
- 1
- 2
- 3
- 4
- 5
Triple Bottom
was formed on 10.04 at 13:50:16 (UTC+0)
signal strength 1 of 5
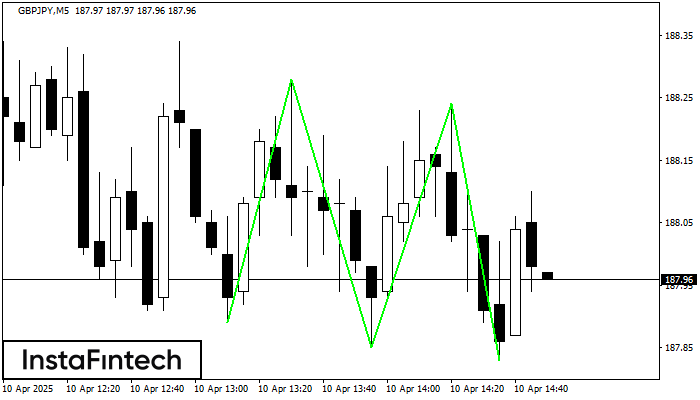
The Triple Bottom pattern has formed on the chart of the GBPJPY M5 trading instrument. The pattern signals a change in the trend from downwards to upwards in the case
The M5 and M15 time frames may have more false entry points.
Open chart in a new window
Bearish Symmetrical Triangle
was formed on 10.04 at 13:45:32 (UTC+0)
signal strength 1 of 5
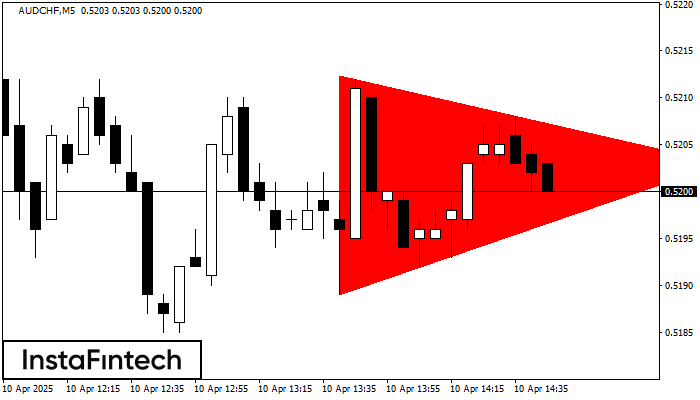
According to the chart of M5, AUDCHF formed the Bearish Symmetrical Triangle pattern. This pattern signals a further downward trend in case the lower border 0.5189 is breached. Here
The M5 and M15 time frames may have more false entry points.
Open chart in a new window
Triple Bottom
was formed on 10.04 at 13:45:31 (UTC+0)
signal strength 2 of 5
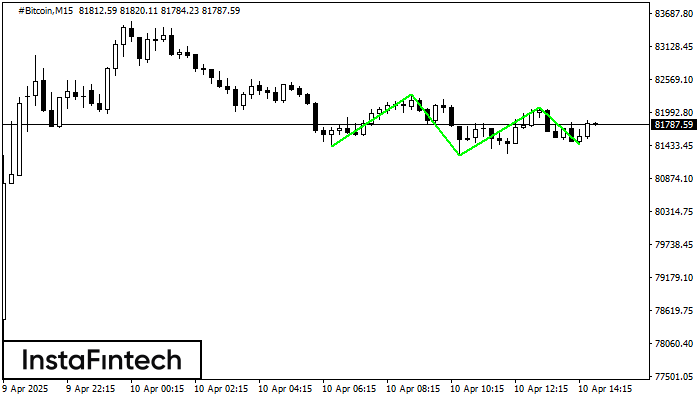
The Triple Bottom pattern has been formed on #Bitcoin M15. It has the following characteristics: resistance level 82303.92/82083.42; support level 81424.56/81461.09; the width is 87936 points. In the event
The M5 and M15 time frames may have more false entry points.
Open chart in a new window


