

Өзекті паттерндер

Медвежий симметричный треугольник
сформирован 01.04 в 09:18:41 (UTC+0)
сила сигнала 4 из 5

На графике NZDJPY H1 сформировалась фигура «Медвежий симметричный треугольник». Характеристика фигуры: Нижняя граница 84.61/84.93; Верхняя граница 85.30/84.93; Проекция ширины фигуры -69 пунктов. Формирование фигуры «Медвежий симметричный треугольник» наиболее вероятным образом свидетельствует о продолжении нисходящего тренда. Это означает, что курс NZDJPY, в случае срабатывания фигуры, пробьет нижнюю границу и, вероятно, проследует к 84.53.
- Все
- Все
- Bearish Rectangle
- Bearish Symmetrical Triangle
- Bearish Symmetrical Triangle
- Bullish Rectangle
- Double Top
- Double Top
- Triple Bottom
- Triple Bottom
- Triple Top
- Triple Top
- Все
- Все
- Покупка
- Продажа
- Все
- 1
- 2
- 3
- 4
- 5
Bullish Rectangle
was formed on 16.04 at 14:30:25 (UTC+0)
signal strength 2 of 5
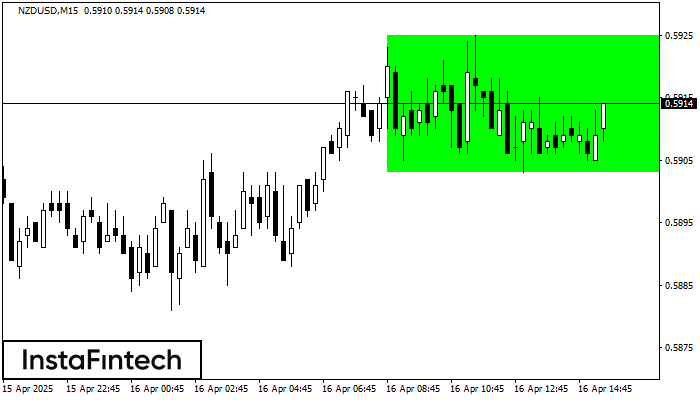
According to the chart of M15, NZDUSD formed the Bullish Rectangle which is a pattern of a trend continuation. The pattern is contained within the following borders: the lower border
The M5 and M15 time frames may have more false entry points.
Open chart in a new window
Bearish Rectangle
was formed on 16.04 at 14:05:33 (UTC+0)
signal strength 1 of 5
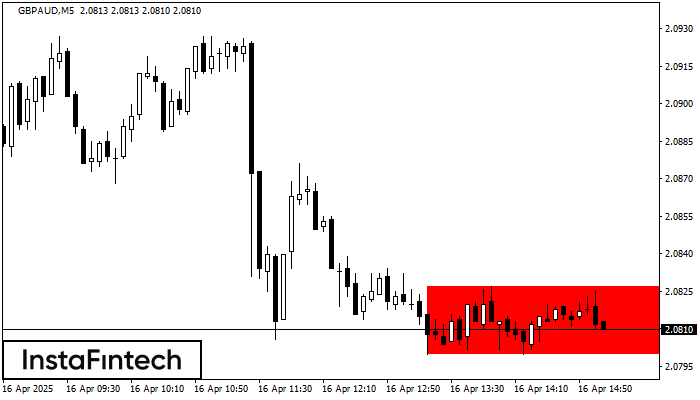
According to the chart of M5, GBPAUD formed the Bearish Rectangle. This type of a pattern indicates a trend continuation. It consists of two levels: resistance 2.0827 - 0.0000
The M5 and M15 time frames may have more false entry points.
Open chart in a new window
Triple Top
was formed on 16.04 at 13:40:08 (UTC+0)
signal strength 1 of 5
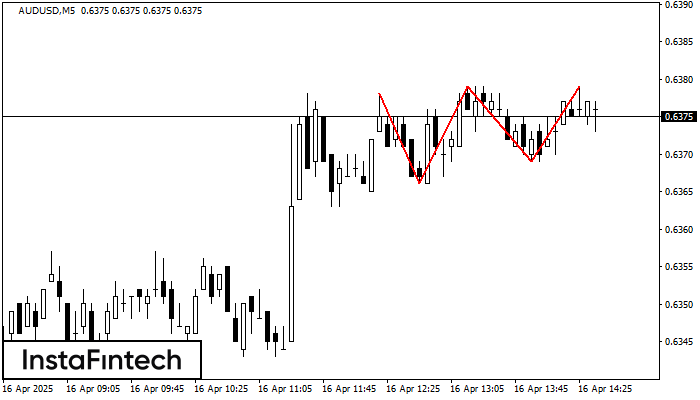
On the chart of the AUDUSD M5 trading instrument, the Triple Top pattern that signals a trend change has formed. It is possible that after formation of the third peak
The M5 and M15 time frames may have more false entry points.
Open chart in a new window


