Өзекті паттерндер

Двойная вершина
сформирован 31.03 в 16:55:27 (UTC+0)
сила сигнала 1 из 5
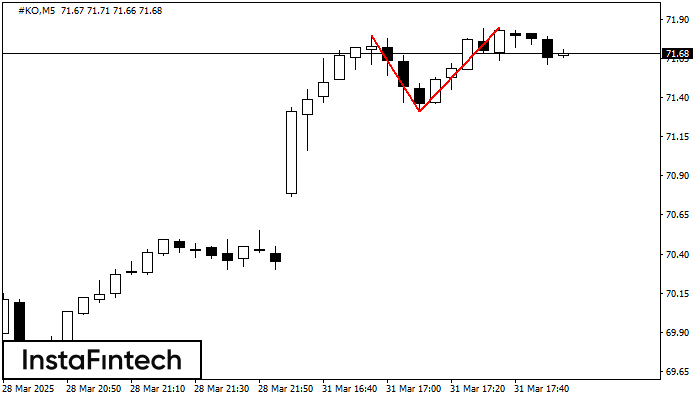
По #KO на M5 сформировалась разворотная фигура «Двойная вершина». Характеристика: Верхняя граница 71.80; Нижняя граница 71.31; Ширина фигуры 54 пунктов. Позицию на продажу возможно открыть ниже нижней границы 71.31, с перспективой хода к уровню 71.16.
Таймфреймы М5 и М15 могут иметь больше ложных точек входа.
- Все
- Все
- Bearish Rectangle
- Bearish Symmetrical Triangle
- Bearish Symmetrical Triangle
- Bullish Rectangle
- Double Top
- Double Top
- Triple Bottom
- Triple Bottom
- Triple Top
- Triple Top
- Все
- Все
- Покупка
- Продажа
- Все
- 1
- 2
- 3
- 4
- 5
Bullish pennant
сформирован 13.04 в 11:56:52 (UTC+0)
сила сигнала 1 из 5

The Bullish pennant signal – Trading instrument #Bitcoin M5, continuation pattern. Forecast: it is possible to set up a buy position above the pattern’s high of 84963.00, with the prospect
The M5 and M15 time frames may have more false entry points.
Открыть график инструмента в новом окне
Bullish Rectangle
сформирован 11.04 в 22:20:31 (UTC+0)
сила сигнала 1 из 5

According to the chart of M5, NZDCHF formed the Bullish Rectangle. The pattern indicates a trend continuation. The upper border is 0.4754, the lower border is 0.4746. The signal means
The M5 and M15 time frames may have more false entry points.
Открыть график инструмента в новом окне
Bearish Rectangle
сформирован 11.04 в 22:10:27 (UTC+0)
сила сигнала 1 из 5

According to the chart of M5, USDCAD formed the Bearish Rectangle which is a pattern of a trend continuation. The pattern is contained within the following borders: lower border 1.3871
The M5 and M15 time frames may have more false entry points.
Открыть график инструмента в новом окне