Двойная вершина
сформирован 31.03 в 10:30:55 (UTC+0)
сила сигнала 3 из 5

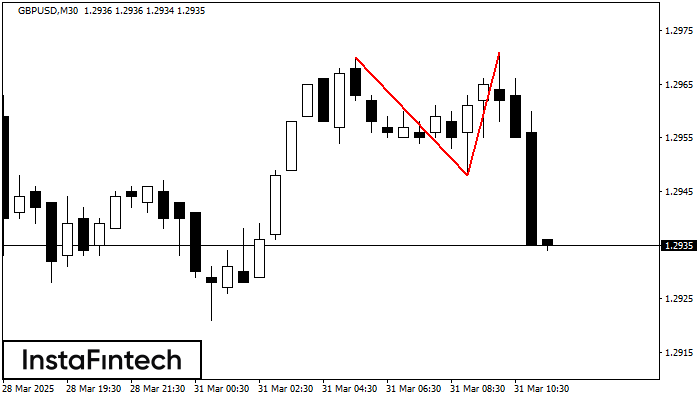
По GBPUSD на M30 сформировалась разворотная фигура «Двойная вершина». Характеристика: Верхняя граница 1.2970; Нижняя граница 1.2948; Ширина фигуры 23 пунктов. Позицию на продажу возможно открыть ниже нижней границы 1.2948, с перспективой хода к уровню 1.2918.
Сондай-ақ қараңыз
- Все
- Все
- Bearish Rectangle
- Bearish Symmetrical Triangle
- Bullish Rectangle
- Double Top
- Double Top
- Triple Bottom
- Triple Bottom
- Triple Top
- Triple Top
- Все
- Все
- Покупка
- Продажа
- Все
- 1
- 2
- 3
- 4
- 5
Bearish Rectangle
was formed on 02.04 at 19:45:31 (UTC+0)
signal strength 1 of 5
According to the chart of M5, AUDCHF formed the Bearish Rectangle. The pattern indicates a trend continuation. The upper border is 0.5569, the lower border is 0.5554. The signal means
The M5 and M15 time frames may have more false entry points.
Open chart in a new window
Double Top
was formed on 02.04 at 19:45:30 (UTC+0)
signal strength 1 of 5
The Double Top reversal pattern has been formed on #TSLA M5. Characteristics: the upper boundary 284.12; the lower boundary 276.07; the width of the pattern is 785 points. Sell trades
The M5 and M15 time frames may have more false entry points.
Open chart in a new window
Double Top
was formed on 02.04 at 19:45:19 (UTC+0)
signal strength 1 of 5
The Double Top pattern has been formed on #TSLA M5. It signals that the trend has been changed from upwards to downwards. Probably, if the base of the pattern 276.07
The M5 and M15 time frames may have more false entry points.
Open chart in a new window