

Өзекті паттерндер

Двойное дно
сформирован 30.03 в 14:25:09 (UTC+0)
сила сигнала 1 из 5
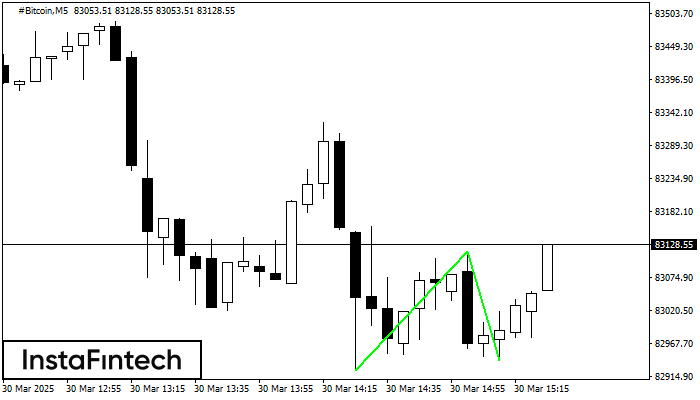
Сформирована фигура «Двойное дно» на графике #Bitcoin M5. Данное формирование сигнализирует об изменении тенденции с нисходящего на восходящее движение. Сигнал: Торговую позицию на покупку следует открывать после пробоя верхней границы фигуры 83117.65, где перспектива будущего хода будет являться шириной текущей фигуры - 19331 пунктов.
Таймфреймы М5 и М15 могут иметь больше ложных точек входа.
Сондай-ақ қараңыз
- Все
- Все
- Bearish Rectangle
- Bearish Symmetrical Triangle
- Bearish Symmetrical Triangle
- Bullish Rectangle
- Double Top
- Double Top
- Triple Bottom
- Triple Bottom
- Triple Top
- Triple Top
- Все
- Все
- Покупка
- Продажа
- Все
- 1
- 2
- 3
- 4
- 5
Bullish Rectangle
was formed on 09.04 at 22:15:27 (UTC+0)
signal strength 1 of 5
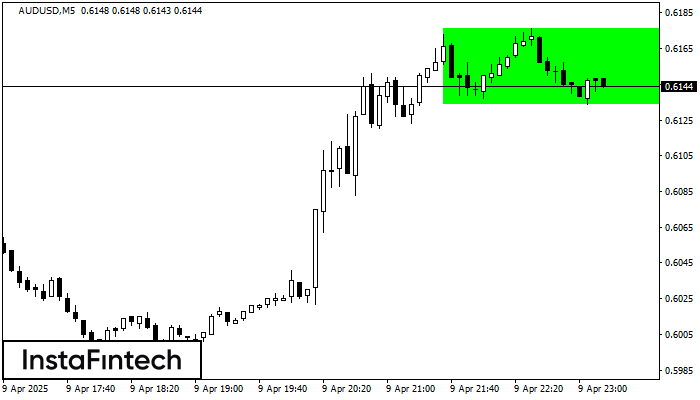
According to the chart of M5, AUDUSD formed the Bullish Rectangle which is a pattern of a trend continuation. The pattern is contained within the following borders: the lower border
The M5 and M15 time frames may have more false entry points.
Open chart in a new window
Double Top
was formed on 09.04 at 22:10:30 (UTC+0)
signal strength 1 of 5
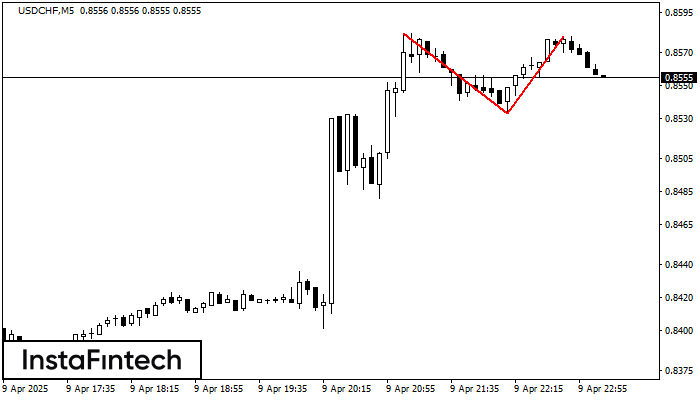
On the chart of USDCHF M5 the Double Top reversal pattern has been formed. Characteristics: the upper boundary 0.8580; the lower boundary 0.8533; the width of the pattern 47 points
The M5 and M15 time frames may have more false entry points.
Open chart in a new window
Double Top
was formed on 09.04 at 22:10:15 (UTC+0)
signal strength 1 of 5
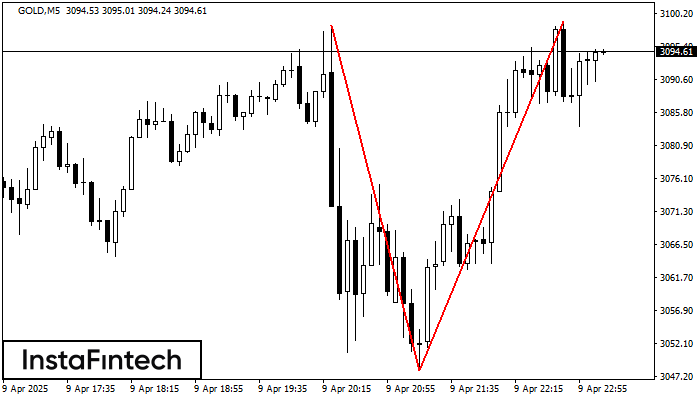
The Double Top pattern has been formed on GOLD M5. It signals that the trend has been changed from upwards to downwards. Probably, if the base of the pattern 3048.18
The M5 and M15 time frames may have more false entry points.
Open chart in a new window


