Өзекті паттерндер

Прямоугольник
сформирован 27.03 в 22:46:39 (UTC+0)
сила сигнала 2 из 5
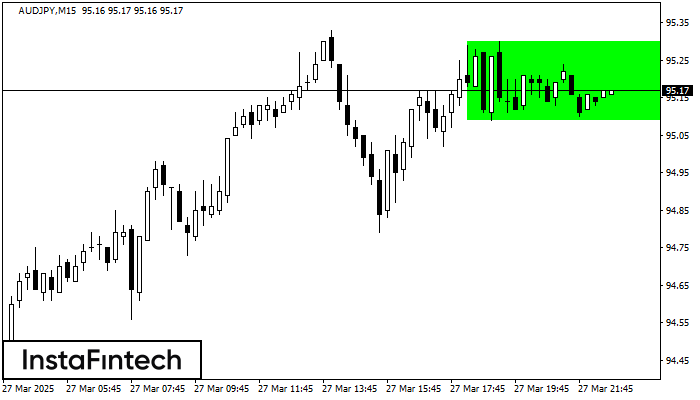
Сформирована фигура «Прямоугольник» на графике AUDJPY M15. Тип фигуры: Продолжение тренда; Границы: Верхняя 95.30, Нижняя 95.09; Сигнал: позицию на покупку следует открывать выше верхней границы прямоугольника 95.30.
Таймфреймы М5 и М15 могут иметь больше ложных точек входа.
Сондай-ақ қараңыз
- Все
- Все
- Bearish Rectangle
- Bearish Symmetrical Triangle
- Bearish Symmetrical Triangle
- Bullish Rectangle
- Double Top
- Double Top
- Triple Bottom
- Triple Bottom
- Triple Top
- Triple Top
- Все
- Все
- Покупка
- Продажа
- Все
- 1
- 2
- 3
- 4
- 5
Double Bottom
сформирован 10.04 в 14:30:27 (UTC+0)
сила сигнала 2 из 5
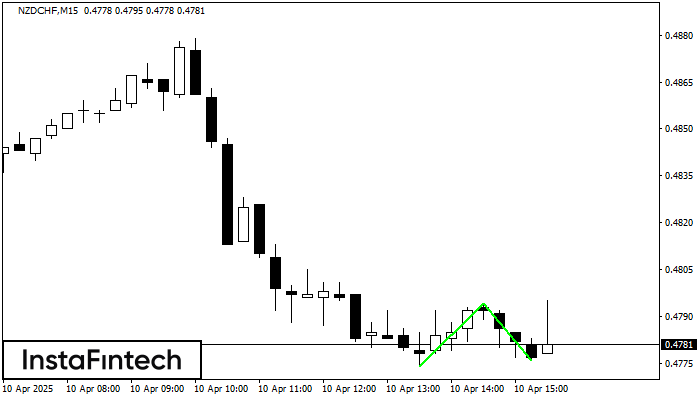
The Double Bottom pattern has been formed on NZDCHF M15. Characteristics: the support level 0.4774; the resistance level 0.4794; the width of the pattern 20 points. If the resistance level
The M5 and M15 time frames may have more false entry points.
Открыть график инструмента в новом окне
Bullish Rectangle
сформирован 10.04 в 14:30:16 (UTC+0)
сила сигнала 3 из 5
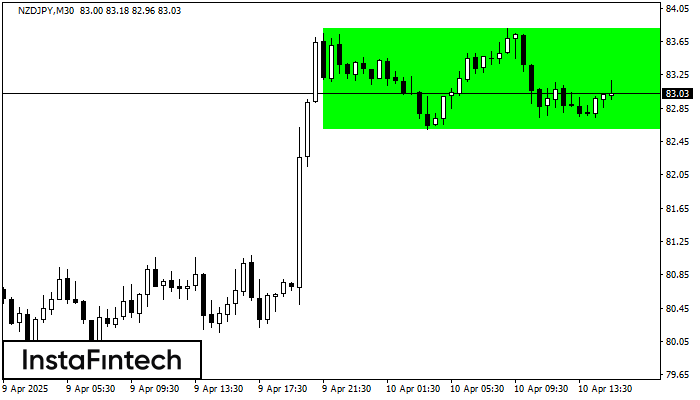
According to the chart of M30, NZDJPY formed the Bullish Rectangle. This type of a pattern indicates a trend continuation. It consists of two levels: resistance 83.80 and support 82.60
Открыть график инструмента в новом окне
Double Bottom
сформирован 10.04 в 14:15:13 (UTC+0)
сила сигнала 2 из 5
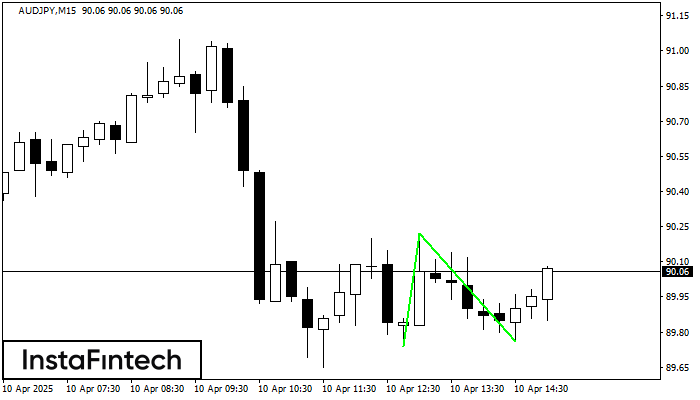
The Double Bottom pattern has been formed on AUDJPY M15. Characteristics: the support level 89.74; the resistance level 90.22; the width of the pattern 48 points. If the resistance level
The M5 and M15 time frames may have more false entry points.
Открыть график инструмента в новом окне