

Өзекті паттерндер

Двойная вершина
сформирован 27.03 в 15:00:15 (UTC+0)
сила сигнала 1 из 5
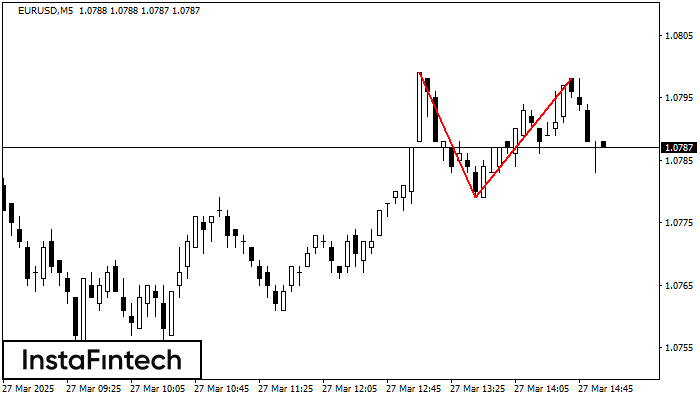
На торговом графике EURUSD M5 сформировалась разворотная фигура «Двойная вершина». Характеристика: Верхняя граница 1.0798; Нижняя граница 1.0779; Ширина фигуры 19 пунктов. Сигнал: Пробой нижней границы 1.0779 приведет к дальнейшему нисходящему движению с перспективой хода к уровню 1.0764.
Таймфреймы М5 и М15 могут иметь больше ложных точек входа.
- Все
- Все
- Bearish Rectangle
- Bearish Symmetrical Triangle
- Bearish Symmetrical Triangle
- Bullish Rectangle
- Double Top
- Double Top
- Triple Bottom
- Triple Bottom
- Triple Top
- Triple Top
- Все
- Все
- Покупка
- Продажа
- Все
- 1
- 2
- 3
- 4
- 5
Double Top
was formed on 16.04 at 17:20:23 (UTC+0)
signal strength 1 of 5
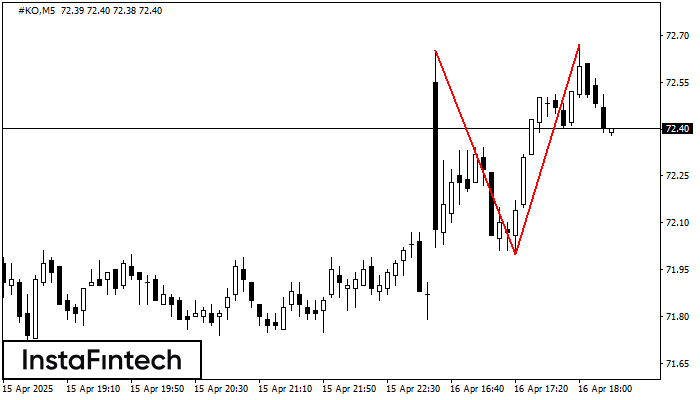
The Double Top pattern has been formed on #KO M5. It signals that the trend has been changed from upwards to downwards. Probably, if the base of the pattern 72.00
The M5 and M15 time frames may have more false entry points.
Open chart in a new window
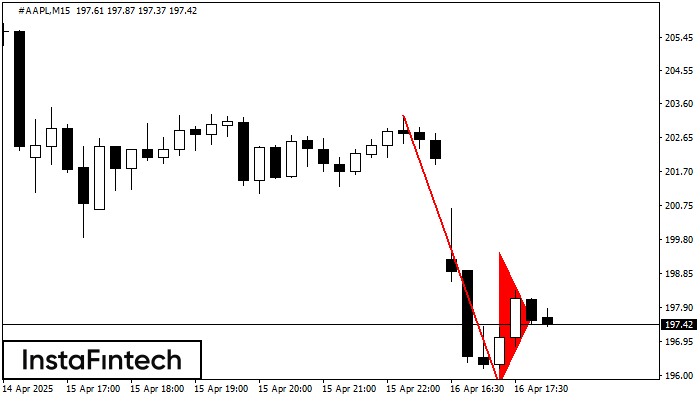
Bearish Flag
was formed on 16.04 at 17:05:48 (UTC+0)
signal strength 2 of 5
The Bearish Flag pattern has been formed on the chart #AAPL M15. Therefore, the downwards trend is likely to continue in the nearest term. As soon as the price breaks
The M5 and M15 time frames may have more false entry points.
Open chart in a new window
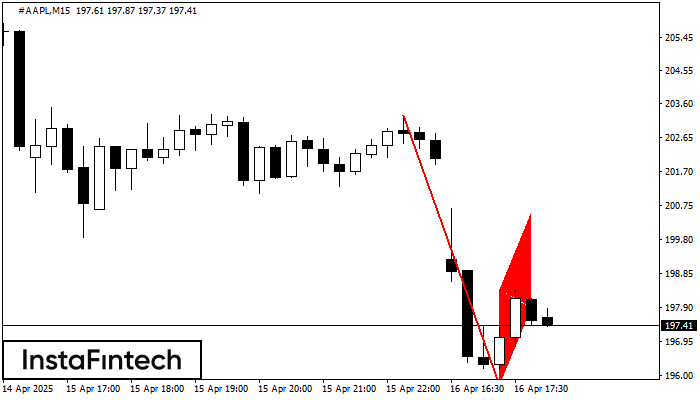
Bearish pennant
was formed on 16.04 at 17:05:44 (UTC+0)
signal strength 2 of 5
The Bearish pennant pattern has formed on the #AAPL M15 chart. This pattern type is characterized by a slight slowdown after which the price will move in the direction
The M5 and M15 time frames may have more false entry points.
Open chart in a new window


