Бычий вымпел
сформирован 26.03 в 12:13:21 (UTC+0)
сила сигнала 2 из 5

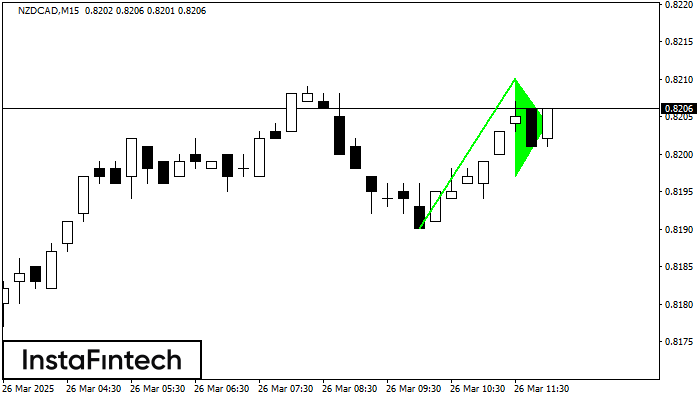
На графике NZDCAD M15 сформировался паттерн «Бычий вымпел», который относится к фигуре продолжения тренда. Можно предполагать, что, в случае фиксации цены выше максимума вымпела 0.8210, возможно дальнейшее восходящее движение.
Таймфреймы М5 и М15 могут иметь больше ложных точек входа.
Сондай-ақ қараңыз
- Все
- Все
- Bearish Rectangle
- Bearish Symmetrical Triangle
- Bullish Rectangle
- Double Top
- Double Top
- Triple Bottom
- Triple Bottom
- Triple Top
- Triple Top
- Все
- Все
- Покупка
- Продажа
- Все
- 1
- 2
- 3
- 4
- 5
Double Bottom
was formed on 25.04 at 11:00:37 (UTC+0)
signal strength 1 of 5
The Double Bottom pattern has been formed on AUDUSD M5. This formation signals a reversal of the trend from downwards to upwards. The signal is that a buy trade should
The M5 and M15 time frames may have more false entry points.
Open chart in a new window
Double Bottom
was formed on 25.04 at 10:50:23 (UTC+0)
signal strength 1 of 5
The Double Bottom pattern has been formed on AUDCHF M5. Characteristics: the support level 0.5304; the resistance level 0.5320; the width of the pattern 16 points. If the resistance level
The M5 and M15 time frames may have more false entry points.
Open chart in a new window
Double Top
was formed on 25.04 at 10:34:49 (UTC+0)
signal strength 1 of 5
On the chart of EURNZD M5 the Double Top reversal pattern has been formed. Characteristics: the upper boundary 1.9026; the lower boundary 1.9002; the width of the pattern 24 points
The M5 and M15 time frames may have more false entry points.
Open chart in a new window