

Өзекті паттерндер

Двойная вершина
сформирован 25.03 в 18:16:02 (UTC+0)
сила сигнала 2 из 5
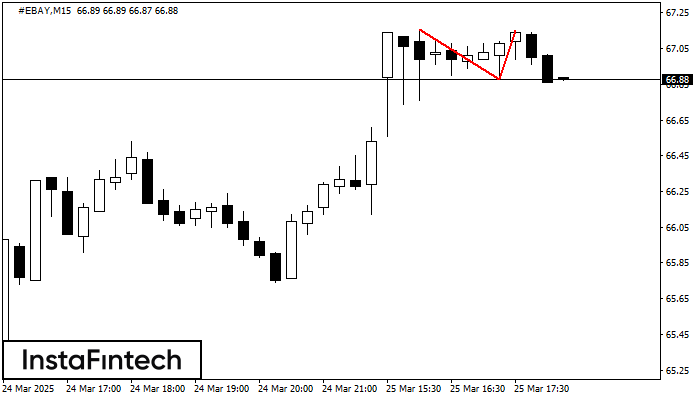
На торговом графике #EBAY M15 сформировалась разворотная фигура «Двойная вершина». Характеристика: Верхняя граница 67.15; Нижняя граница 66.88; Ширина фигуры 27 пунктов. Сигнал: Пробой нижней границы 66.88 приведет к дальнейшему нисходящему движению с перспективой хода к уровню 66.65.
Таймфреймы М5 и М15 могут иметь больше ложных точек входа.
- Все
- Все
- Bearish Rectangle
- Bearish Symmetrical Triangle
- Bearish Symmetrical Triangle
- Bullish Rectangle
- Double Top
- Double Top
- Triple Bottom
- Triple Bottom
- Triple Top
- Triple Top
- Все
- Все
- Покупка
- Продажа
- Все
- 1
- 2
- 3
- 4
- 5
Double Top
was formed on 16.04 at 09:00:29 (UTC+0)
signal strength 4 of 5
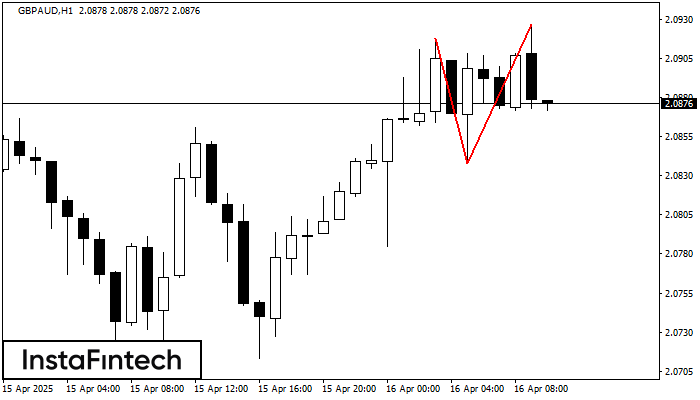
On the chart of GBPAUD H1 the Double Top reversal pattern has been formed. Characteristics: the upper boundary 2.0927; the lower boundary 2.0838; the width of the pattern 89 points
Open chart in a new window
Double Bottom
was formed on 16.04 at 08:35:10 (UTC+0)
signal strength 1 of 5
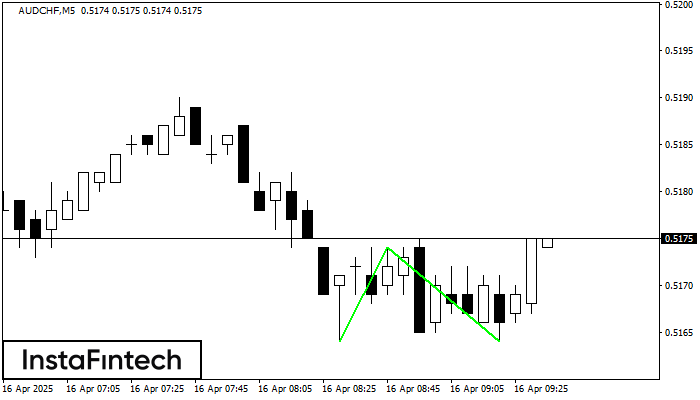
The Double Bottom pattern has been formed on AUDCHF M5. Characteristics: the support level 0.5164; the resistance level 0.5174; the width of the pattern 10 points. If the resistance level
The M5 and M15 time frames may have more false entry points.
Open chart in a new window
Bearish Symmetrical Triangle
was formed on 16.04 at 07:24:04 (UTC+0)
signal strength 1 of 5

According to the chart of M5, #Bitcoin formed the Bearish Symmetrical Triangle pattern. This pattern signals a further downward trend in case the lower border 83067.39 is breached. Here
The M5 and M15 time frames may have more false entry points.
Open chart in a new window


