Голова и плечи
сформирован 25.03 в 17:01:08 (UTC+0)
сила сигнала 1 из 5

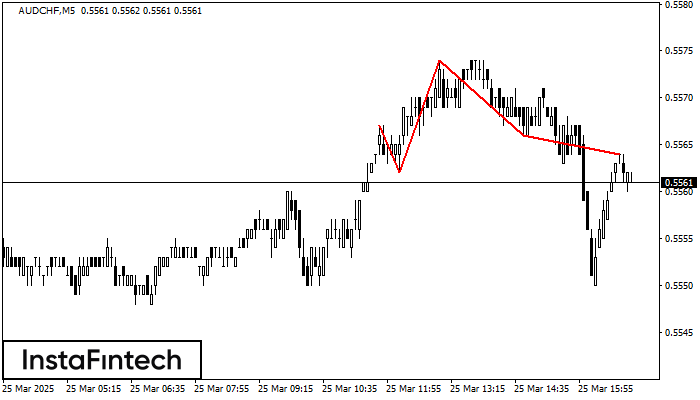
Графическая фигура «Голова и плечи» сформировалась по инструменту AUDCHF на M5. Вероятно предполагать, что после формирования правого плеча цена преодолеет уровень шеи 0.5562/0.5566, изменяя тем самым тенденцию и фактически направляя нас к значению 0.5551.
Таймфреймы М5 и М15 могут иметь больше ложных точек входа.
Сондай-ақ қараңыз
- Все
- Все
- Bearish Rectangle
- Bearish Symmetrical Triangle
- Bullish Rectangle
- Double Top
- Double Top
- Triple Bottom
- Triple Bottom
- Triple Top
- Triple Top
- Все
- Все
- Покупка
- Продажа
- Все
- 1
- 2
- 3
- 4
- 5
Double Top
was formed on 22.04 at 09:00:07 (UTC+0)
signal strength 4 of 5
The Double Top pattern has been formed on NZDCAD H1. It signals that the trend has been changed from upwards to downwards. Probably, if the base of the pattern 0.8276
Open chart in a new window
Head and Shoulders
was formed on 22.04 at 08:55:22 (UTC+0)
signal strength 1 of 5
The technical pattern called Head and Shoulders has appeared on the chart of GOLD M5. There are weighty reasons to suggest that the price will surpass the Neckline 3473.12/3476.36 after
The M5 and M15 time frames may have more false entry points.
Open chart in a new window
Bearish Symmetrical Triangle
was formed on 22.04 at 08:47:25 (UTC+0)
signal strength 1 of 5
According to the chart of M5, EURNZD formed the Bearish Symmetrical Triangle pattern. This pattern signals a further downward trend in case the lower border 1.9139 is breached. Here
The M5 and M15 time frames may have more false entry points.
Open chart in a new window