Двойная вершина
сформирован 25.03 в 04:00:34 (UTC+0)
сила сигнала 2 из 5

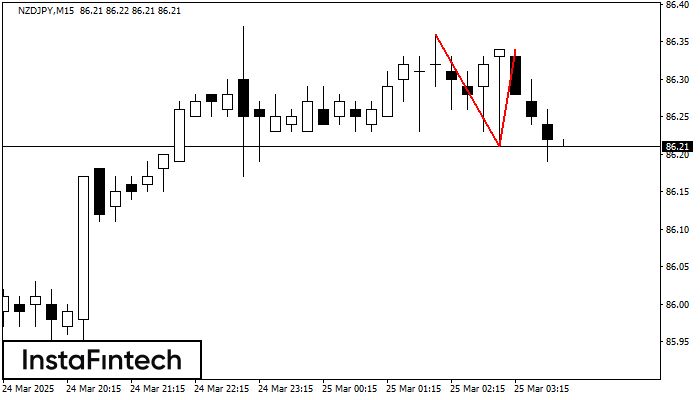
На торговом графике NZDJPY M15 сформировалась разворотная фигура «Двойная вершина». Характеристика: Верхняя граница 86.34; Нижняя граница 86.21; Ширина фигуры 13 пунктов. Сигнал: Пробой нижней границы 86.21 приведет к дальнейшему нисходящему движению с перспективой хода к уровню 85.99.
Таймфреймы М5 и М15 могут иметь больше ложных точек входа.
Сондай-ақ қараңыз
- Все
- Все
- Bearish Rectangle
- Bearish Symmetrical Triangle
- Bullish Rectangle
- Double Top
- Double Top
- Triple Bottom
- Triple Bottom
- Triple Top
- Triple Top
- Все
- Все
- Покупка
- Продажа
- Все
- 1
- 2
- 3
- 4
- 5
Double Bottom
сформирован 31.03 в 11:30:40 (UTC+0)
сила сигнала 1 из 5
The Double Bottom pattern has been formed on GBPUSD M5; the upper boundary is 1.2948; the lower boundary is 1.2934. The width of the pattern is 14 points. In case
The M5 and M15 time frames may have more false entry points.
Открыть график инструмента в новом окне
Double Bottom
сформирован 31.03 в 11:30:28 (UTC+0)
сила сигнала 2 из 5
The Double Bottom pattern has been formed on GBPJPY M15; the upper boundary is 193.33; the lower boundary is 192.78. The width of the pattern is 60 points. In case
The M5 and M15 time frames may have more false entry points.
Открыть график инструмента в новом окне
Bullish Symmetrical Triangle
сформирован 31.03 в 11:25:28 (UTC+0)
сила сигнала 1 из 5
According to the chart of M5, GBPAUD formed the Bullish Symmetrical Triangle pattern. The lower border of the pattern touches the coordinates 2.0658/2.0675 whereas the upper border goes across 2.0687/2.0675
The M5 and M15 time frames may have more false entry points.
Открыть график инструмента в новом окне