

Өзекті паттерндер

Двойное дно
сформирован 25.03 в 02:55:11 (UTC+0)
сила сигнала 1 из 5
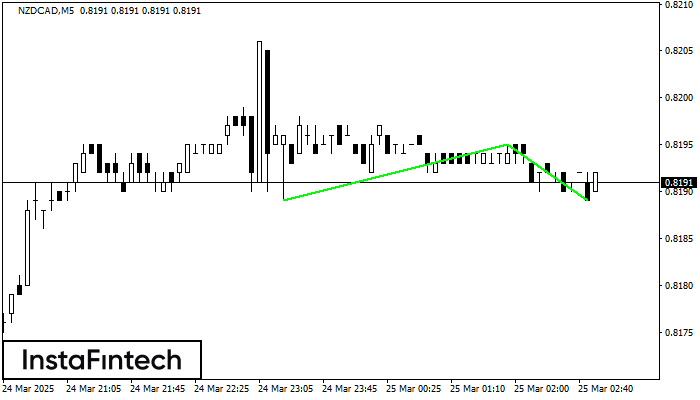
Сформирована фигура «Двойное дно» на графике NZDCAD M5. Верхняя граница 0.8195; Нижняя граница 0.8189; Ширина фигуры 6 пунктов. В случае пробоя верхней границы 0.8195 можно будет прогнозировать изменение тенденции, где ширина фигуры и будет являться расстоянием предположительного Тейк Профита.
Таймфреймы М5 и М15 могут иметь больше ложных точек входа.
Сондай-ақ қараңыз
- Все
- Все
- Bearish Rectangle
- Bearish Symmetrical Triangle
- Bearish Symmetrical Triangle
- Bullish Rectangle
- Double Top
- Double Top
- Triple Bottom
- Triple Bottom
- Triple Top
- Triple Top
- Все
- Все
- Покупка
- Продажа
- Все
- 1
- 2
- 3
- 4
- 5
Triple Top
was formed on 31.03 at 10:00:28 (UTC+0)
signal strength 3 of 5

On the chart of the EURUSD M30 trading instrument, the Triple Top pattern that signals a trend change has formed. It is possible that after formation of the third peak
Open chart in a new window
Double Bottom
was formed on 31.03 at 10:00:26 (UTC+0)
signal strength 3 of 5

The Double Bottom pattern has been formed on USDJPY M30. This formation signals a reversal of the trend from downwards to upwards. The signal is that a buy trade should
Open chart in a new window
Double Bottom
was formed on 31.03 at 10:00:23 (UTC+0)
signal strength 3 of 5
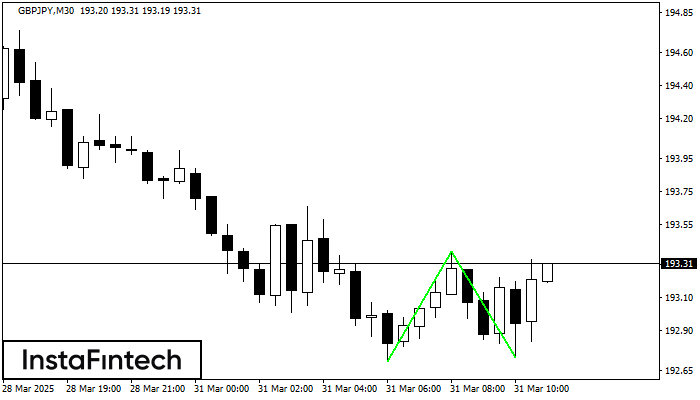
The Double Bottom pattern has been formed on GBPJPY M30. This formation signals a reversal of the trend from downwards to upwards. The signal is that a buy trade should
Open chart in a new window


