

Өзекті паттерндер

Двойное дно
сформирован 25.03 в 00:00:26 (UTC+0)
сила сигнала 5 из 5
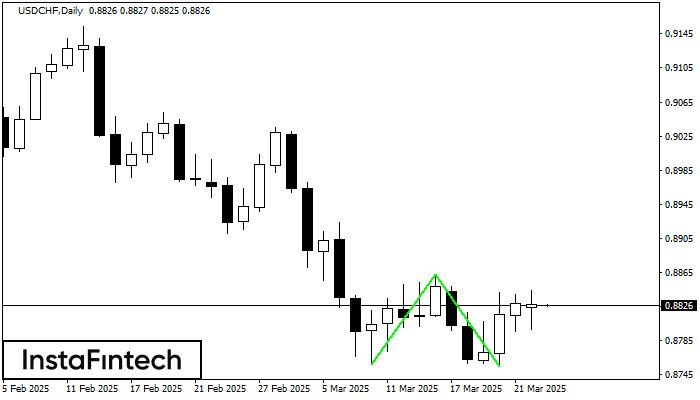
Сформирована фигура «Двойное дно» на графике USDCHF D1. Характеристика: Уровень поддержки 0.8757; Уровень сопротивления 0.8863; Ширина фигуры 106 пунктов. В случае пробоя уровня сопротивления можно будет прогнозировать изменение тенденции, где первая точка фиксации прибыли находится на расстоянии 108 пунктов.
Сондай-ақ қараңыз
- Все
- Все
- Bearish Rectangle
- Bearish Symmetrical Triangle
- Bearish Symmetrical Triangle
- Bullish Rectangle
- Double Top
- Double Top
- Triple Bottom
- Triple Bottom
- Triple Top
- Triple Top
- Все
- Все
- Покупка
- Продажа
- Все
- 1
- 2
- 3
- 4
- 5
Bullish pennant
сформирован 14.04 в 01:45:23 (UTC+0)
сила сигнала 2 из 5
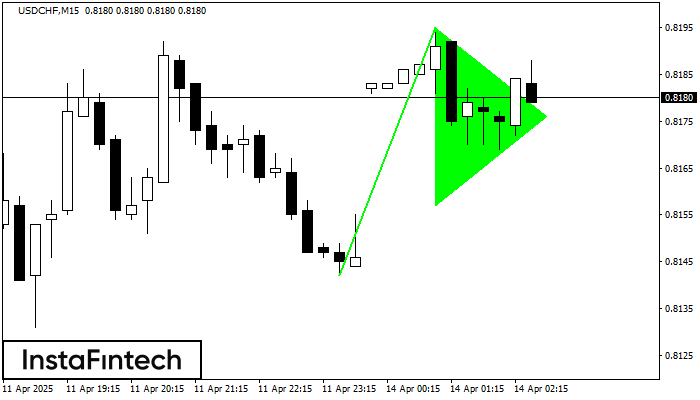
The Bullish pennant signal – Trading instrument USDCHF M15, continuation pattern. Forecast: it is possible to set up a buy position above the pattern’s high of 0.8195, with the prospect
The M5 and M15 time frames may have more false entry points.
Открыть график инструмента в новом окне
Double Bottom
сформирован 14.04 в 01:30:09 (UTC+0)
сила сигнала 2 из 5
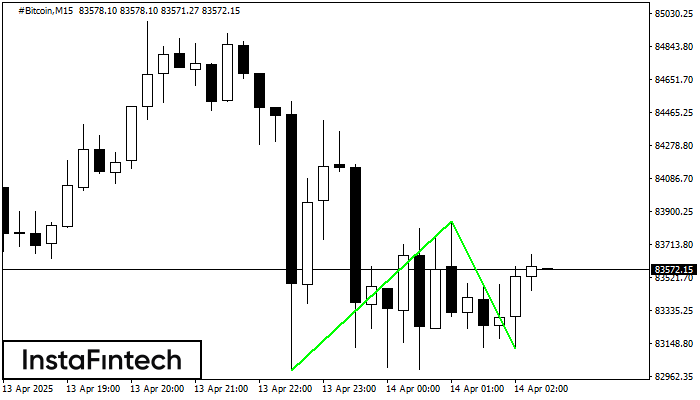
The Double Bottom pattern has been formed on #Bitcoin M15; the upper boundary is 83846.39; the lower boundary is 83118.34. The width of the pattern is 85123 points. In case
The M5 and M15 time frames may have more false entry points.
Открыть график инструмента в новом окне
Bullish Rectangle
сформирован 14.04 в 01:17:49 (UTC+0)
сила сигнала 2 из 5
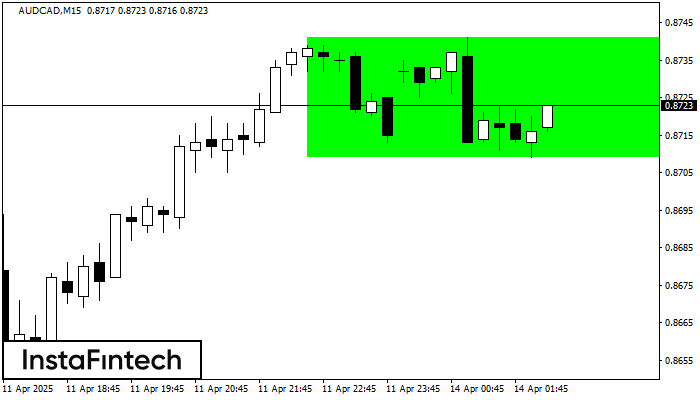
According to the chart of M15, AUDCAD formed the Bullish Rectangle. This type of a pattern indicates a trend continuation. It consists of two levels: resistance 0.8741 and support 0.8709
The M5 and M15 time frames may have more false entry points.
Открыть график инструмента в новом окне


