

Өзекті паттерндер

Тройное дно
сформирован 24.03 в 18:09:58 (UTC+0)
сила сигнала 1 из 5
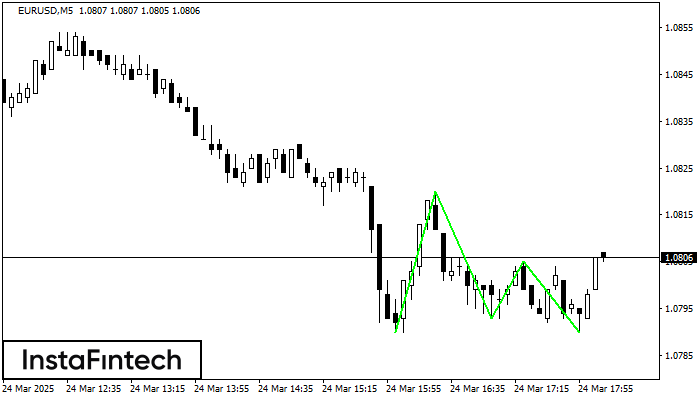
Сформирована фигура «Тройное дно» по торговому инструменту EURUSD на M5. Фигура сигнализирует об изменении тенденции с нисходящей на восходящую в случае пробоя верхней границы 1.0805.
Таймфреймы М5 и М15 могут иметь больше ложных точек входа.
Сондай-ақ қараңыз
- Все
- Все
- Bearish Rectangle
- Bearish Symmetrical Triangle
- Bearish Symmetrical Triangle
- Bullish Rectangle
- Double Top
- Double Top
- Triple Bottom
- Triple Bottom
- Triple Top
- Triple Top
- Все
- Все
- Покупка
- Продажа
- Все
- 1
- 2
- 3
- 4
- 5
Head and Shoulders
сформирован 31.03 в 08:40:22 (UTC+0)
сила сигнала 1 из 5

According to the chart of M5, GBPAUD formed the Head and Shoulders pattern. The Head’s top is set at 2.0644 while the median line of the Neck is found
The M5 and M15 time frames may have more false entry points.
Открыть график инструмента в новом окне
Triple Top
сформирован 31.03 в 08:30:26 (UTC+0)
сила сигнала 3 из 5

The Triple Top pattern has formed on the chart of the EURCAD M30. Features of the pattern: borders have an ascending angle; the lower line of the pattern
Открыть график инструмента в новом окне
Head and Shoulders
сформирован 31.03 в 08:30:17 (UTC+0)
сила сигнала 3 из 5

The technical pattern called Head and Shoulders has appeared on the chart of EURGBP M30. There are weighty reasons to suggest that the price will surpass the Neckline 0.8358/0.8357 after
Открыть график инструмента в новом окне


