

Actual patterns

Patterns are graphical models which are formed in the chart by the price. According to one of the technical analysis postulates, history (price movement) repeats itself. It means that the price movements are often similar in the same situations which makes it possible to predict the further development of the situation with a high probability.
Relevant patterns by InstaTrade is an easy-to-use service which allows you to be aware of latest changes in the market and react to clues from the market in time. In our service you will always find the latest and most relevant patterns on any pair and any timeframe.
Bullish Rectangle
was formed on 03.04 at 05:24:47 (UTC+0)
signal strength 1 of 5
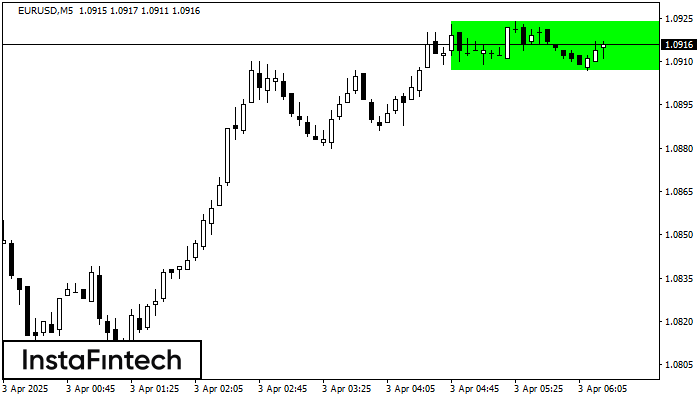
According to the chart of M5, EURUSD formed the Bullish Rectangle which is a pattern of a trend continuation. The pattern is contained within the following borders: the lower border 1.0907 – 1.0907 and upper border 1.0924 – 1.0924. In case the upper border is broken, the instrument is likely to follow the upward trend.
The M5 and M15 time frames may have more false entry points.
- All
- All
- Bearish Rectangle
- Bearish Symmetrical Triangle
- Bearish Symmetrical Triangle
- Bullish Rectangle
- Double Top
- Double Top
- Triple Bottom
- Triple Bottom
- Triple Top
- Triple Top
- All
- All
- Buy
- Sale
- All
- 1
- 2
- 3
- 4
- 5
Bullish Symmetrical Triangle
was formed on 22.04 at 20:06:01 (UTC+0)
signal strength 1 of 5
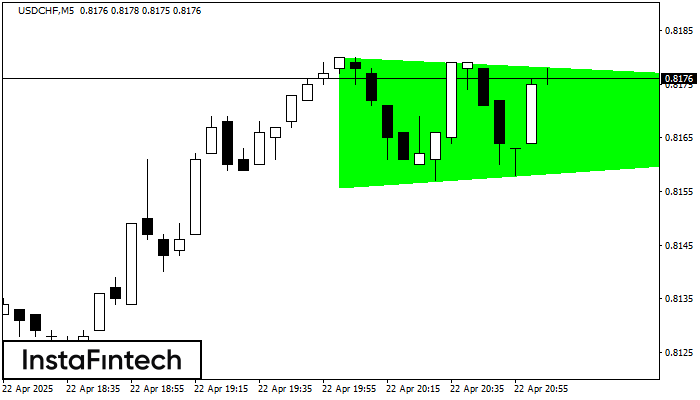
According to the chart of M5, USDCHF formed the Bullish Symmetrical Triangle pattern, which signals the trend will continue. Description. The upper border of the pattern touches the coordinates 0.8180/0.8170
The M5 and M15 time frames may have more false entry points.
Open chart in a new window
Bullish Rectangle
was formed on 22.04 at 20:05:56 (UTC+0)
signal strength 1 of 5
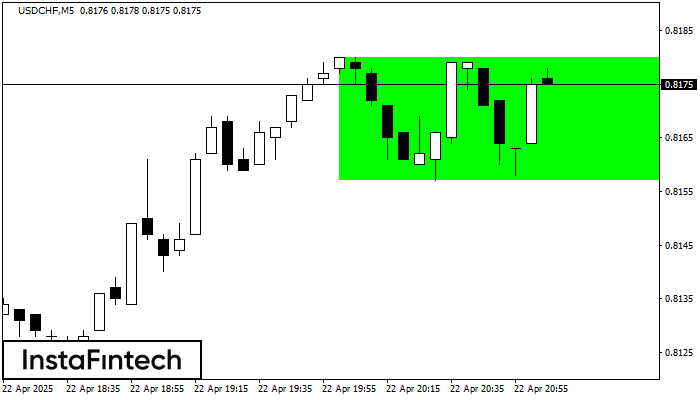
According to the chart of M5, USDCHF formed the Bullish Rectangle which is a pattern of a trend continuation. The pattern is contained within the following borders: the lower border
The M5 and M15 time frames may have more false entry points.
Open chart in a new window
Double Bottom
was formed on 22.04 at 20:00:25 (UTC+0)
signal strength 1 of 5
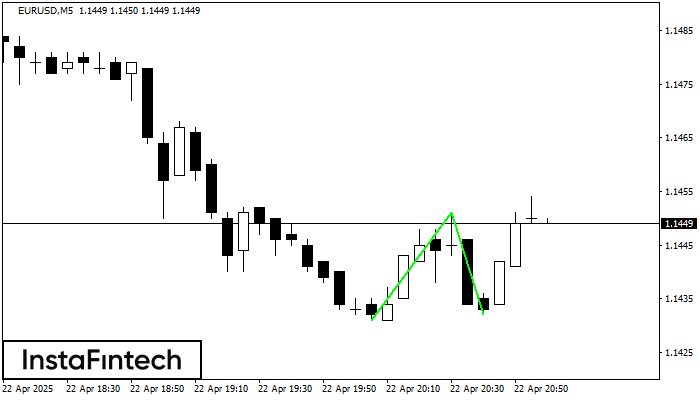
The Double Bottom pattern has been formed on EURUSD M5; the upper boundary is 1.1451; the lower boundary is 1.1432. The width of the pattern is 20 points. In case
The M5 and M15 time frames may have more false entry points.
Open chart in a new window
Double Bottom
was formed on 22.04 at 19:15:32 (UTC+0)
signal strength 1 of 5
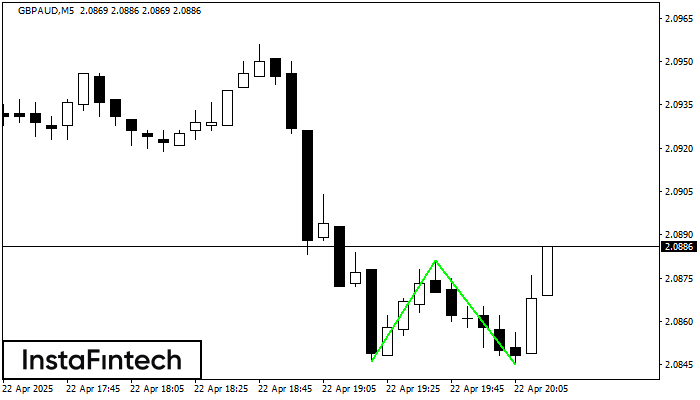
The Double Bottom pattern has been formed on GBPAUD M5; the upper boundary is 2.0881; the lower boundary is 2.0845. The width of the pattern is 35 points. In case
The M5 and M15 time frames may have more false entry points.
Open chart in a new window
Triple Top
was formed on 22.04 at 19:15:08 (UTC+0)
signal strength 1 of 5
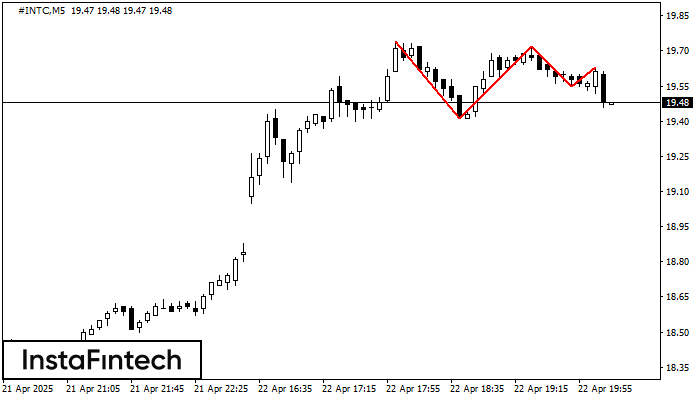
The Triple Top pattern has formed on the chart of the #INTC M5. Features of the pattern: borders have an ascending angle; the lower line of the pattern
The M5 and M15 time frames may have more false entry points.
Open chart in a new window
Double Top
was formed on 22.04 at 19:05:20 (UTC+0)
signal strength 1 of 5
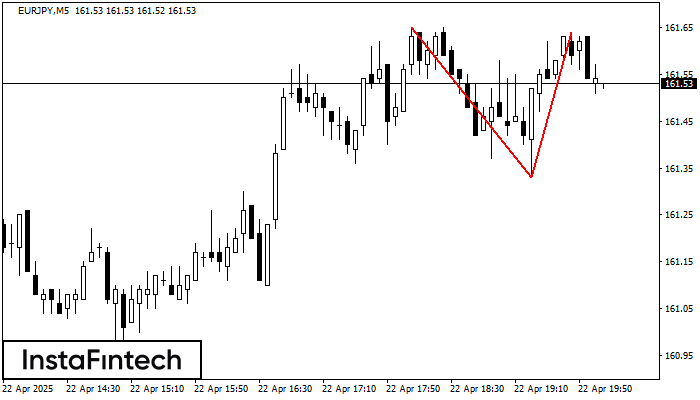
The Double Top pattern has been formed on EURJPY M5. It signals that the trend has been changed from upwards to downwards. Probably, if the base of the pattern 161.33
The M5 and M15 time frames may have more false entry points.
Open chart in a new window
Head and Shoulders
was formed on 22.04 at 19:00:29 (UTC+0)
signal strength 4 of 5
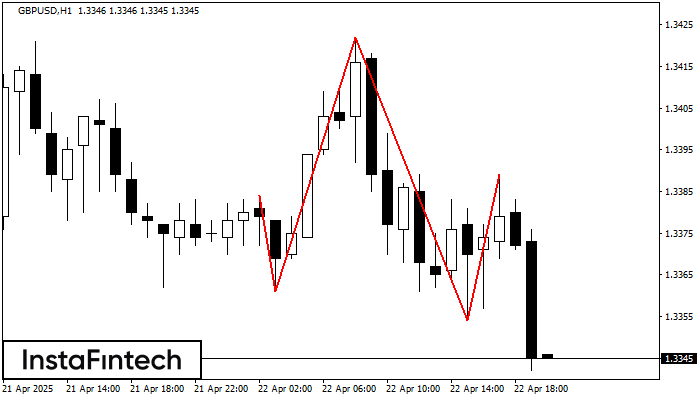
The GBPUSD H1 formed the Head and Shoulders pattern with the following features: The Head’s top is at 1.3422, the Neckline and the upward angle are at 1.3361/1.3354. The formation
Open chart in a new window
Double Top
was formed on 22.04 at 18:40:05 (UTC+0)
signal strength 1 of 5
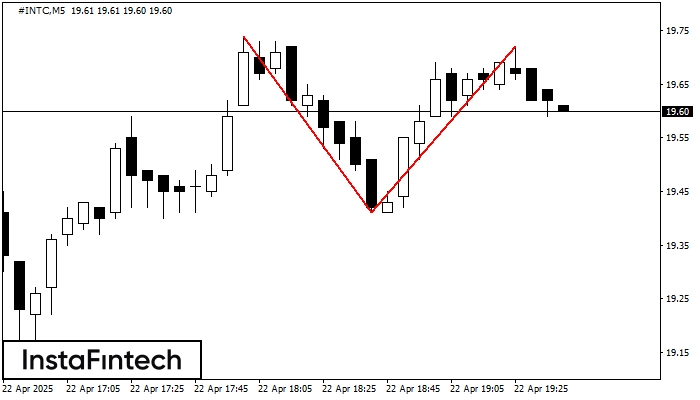
On the chart of #INTC M5 the Double Top reversal pattern has been formed. Characteristics: the upper boundary 19.72; the lower boundary 19.41; the width of the pattern 31 points
The M5 and M15 time frames may have more false entry points.
Open chart in a new window
Double Top
was formed on 22.04 at 18:10:32 (UTC+0)
signal strength 1 of 5
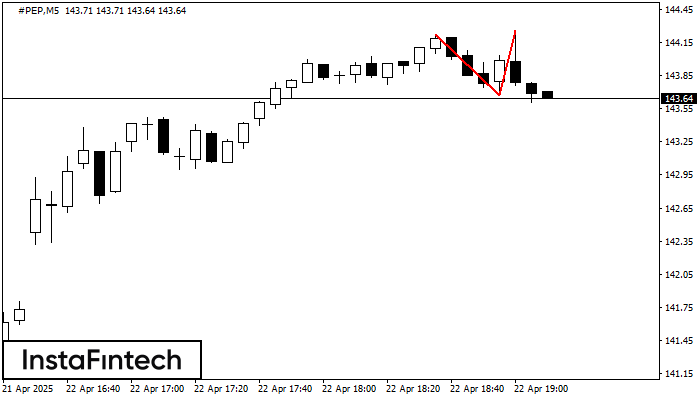
On the chart of #PEP M5 the Double Top reversal pattern has been formed. Characteristics: the upper boundary 144.26; the lower boundary 143.67; the width of the pattern 59 points
The M5 and M15 time frames may have more false entry points.
Open chart in a new window


