

Actual patterns

Patterns are graphical models which are formed in the chart by the price. According to one of the technical analysis postulates, history (price movement) repeats itself. It means that the price movements are often similar in the same situations which makes it possible to predict the further development of the situation with a high probability.
Relevant patterns by InstaTrade is an easy-to-use service which allows you to be aware of latest changes in the market and react to clues from the market in time. In our service you will always find the latest and most relevant patterns on any pair and any timeframe.
Bullish Rectangle
was formed on 02.04 at 02:16:17 (UTC+0)
signal strength 1 of 5
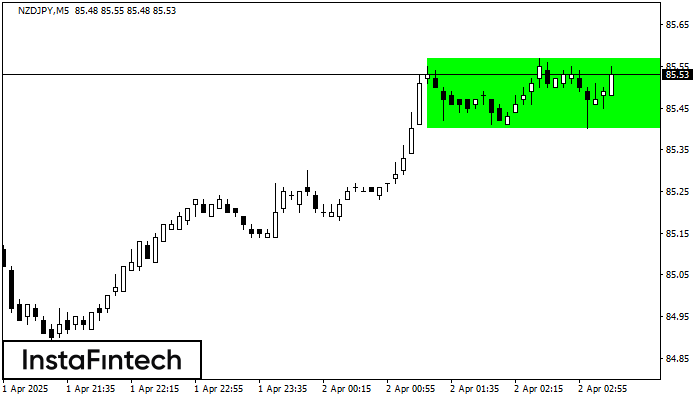
According to the chart of M5, NZDJPY formed the Bullish Rectangle which is a pattern of a trend continuation. The pattern is contained within the following borders: the lower border 85.40 – 85.40 and upper border 85.57 – 85.57. In case the upper border is broken, the instrument is likely to follow the upward trend.
The M5 and M15 time frames may have more false entry points.
- All
- All
- Bearish Rectangle
- Bearish Symmetrical Triangle
- Bearish Symmetrical Triangle
- Bullish Rectangle
- Double Top
- Double Top
- Triple Bottom
- Triple Bottom
- Triple Top
- Triple Top
- All
- All
- Buy
- Sale
- All
- 1
- 2
- 3
- 4
- 5
Double Top
was formed on 21.04 at 22:26:30 (UTC+0)
signal strength 1 of 5

Corak pembalikan Double Top telah dibentuk pada AUDCAD M5. Ciri-ciri: sempadan atas %P0.000000; sempadan bawah 0.8880; sempadan bawah 0.8869; lebar corak adalah 11 mata. Dagangan menjual adalah lebih baik untuk
Carta masa M5 dan M15 mungkin mempunyai lebih banyak titik kemasukan palsu.
Open chart in a new window
Triple Bottom
was formed on 21.04 at 22:01:24 (UTC+0)
signal strength 3 of 5

Corak Triple Bottom telah dibentuk pada carta bagi instrumen dagangan USDJPY M30. Corak menandakan perubahan aliran dari menurun ke aliran menaik dalam sekiranya penembusan 141.08/141.05
Open chart in a new window
Double Bottom
was formed on 21.04 at 22:00:49 (UTC+0)
signal strength 4 of 5

Corak Double Bottom telah dibentuk pada AUDCHF H1; sempadan atas adalah 0.5198; sempadan bawah adalah 0.5165. Lebar corak adalah 34 mata. Sekiranya penembusan sempadan atas 0.5198, perubahan aliran boleh diramalkan
Open chart in a new window


