यह भी देखें


झंडा एक मॉडल है जो प्रवृत्ति की निरंतरता की भविष्यवाणी करता है। प्रवृत्ति निरंतरता के साथ-साथ अन्य समान आंकड़े, यह तेजी से मूल्य आंदोलन के बाद गठित होता है और मंदी के समान होता है। जब फ्लैट पूरा हो जाता है, तो प्रवृत्ति की निरंतरता के बाद, आम तौर पर पहले की प्रवृत्ति के समान ही मजबूत होती है।
फ्लैग चार्ट पॅटर्न प्रमुख चार्ट पैटर्न में से एक है। यह एक निरंतर संकेत है जो एक प्रवृत्ति की आगे की दिशा को इंगित करता है। नवागंतुकों और पेशेवरों के पास इस पैटर्न के बारे में अलग-अलग विचार हैं। शुरुआती लोगों के लिए इसका मतलब है कि आने वाले फ्लैट बाजार में, बाजार बफ इसे एक प्रवृत्ति के रूप में देखते हैं जिसके बाद समान बल के साथ निरंतरता होती है। इस बीच, कीमत की दिशा कोई फर्क नहीं पड़ता। ध्वज एक अपरिवर्तनीय और डाउनट्रेंड के दौरान दोनों रूपों बनाता है।
गठन का मूल मानदंड:
यह ध्यान देने योग्य है कि यह एल्गोरिदम सभी चार्ट पैटर्न के लिए लागू है। और इस तथ्य के बावजूद कि कुछ व्यापारी अनुमानित लाभ के एक महत्वपूर्ण हिस्से के नुकसान के बारे में चिंतित हैं, यह दृष्टिकोण पूरी तरह से उचित है।
यह देखते हुए कि बाजार अप्रत्याशित है, यहां तक कि सबसे विश्वसनीय पैटर्न हमेशा काम नहीं करते हैं। इसलिए हम अनुशंसा करते हैं कि आप इसे उसी तरह उपयोग करें। खोए गए लाभ का पहला 30% झूठे ब्रेकआउट के जोखिम को खत्म कर देगा, जबकि अन्य 30% अपूर्ण कसरत के खिलाफ बचाव करेंगे।
वैकल्पिक रूप से, यदि, अपेक्षित लाभ के 70% तक पहुंचने के बाद, आगे की कीमत दिशा के बारे में 2-3 स्पष्ट संकेत होंगे, तो आप हमेशा व्यापार को छोड़ सकते हैं।
अंत में, इस तथ्य पर ध्यान दें कि ध्वज पैटर्न के गठन से पहले तेज वृद्धि कुछ महत्वपूर्ण समाचारों के बाद हो सकती है। और इसका मतलब कसरत की कम संभावना है। इसलिए, ध्वज पैटर्न का व्यापार, सावधानी से बताएं कि इसका गठन क्यों हुआ।

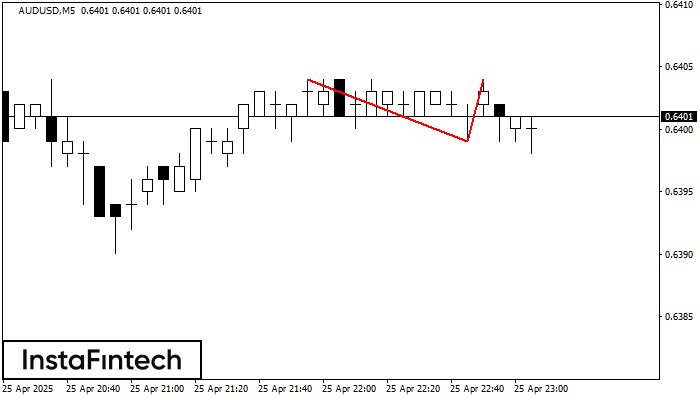
The Double Top pattern has been formed on AUDUSD M5. It signals that the trend has been changed from upwards to downwards. Probably, if the base of the pattern 0.6399
The M5 and M15 time frames may have more false entry points.
Open chart in a new window

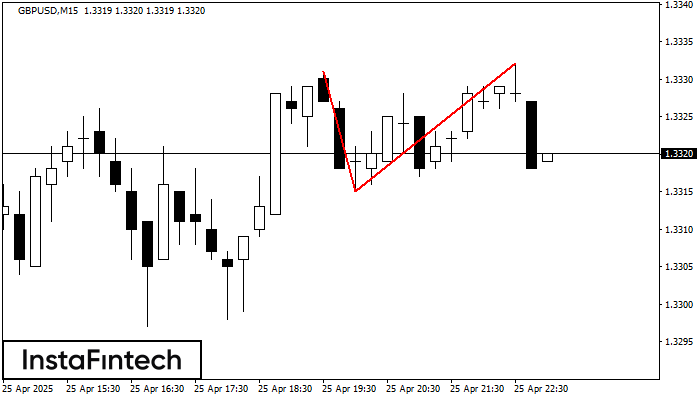
On the chart of GBPUSD M15 the Double Top reversal pattern has been formed. Characteristics: the upper boundary 1.3332; the lower boundary 1.3315; the width of the pattern 17 points
The M5 and M15 time frames may have more false entry points.
Open chart in a new window

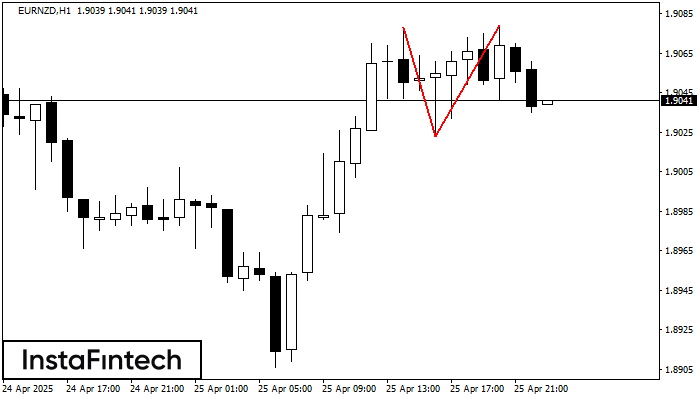
On the chart of EURNZD H1 the Double Top reversal pattern has been formed. Characteristics: the upper boundary 1.9079; the lower boundary 1.9023; the width of the pattern 56 points
Open chart in a new windowइंस्टाफॉरेक्स क्लब

Your IP address shows that you are currently located in the USA. If you are a resident of the United States, you are prohibited from using the services of InstaFintech Group including online trading, online transfers, deposit/withdrawal of funds, etc.
If you think you are seeing this message by mistake and your location is not the US, kindly proceed to the website. Otherwise, you must leave the website in order to comply with government restrictions.
Why does your IP address show your location as the USA?
Please confirm whether you are a US resident or not by clicking the relevant button below. If you choose the wrong option, being a US resident, you will not be able to open an account with InstaTrade anyway.
We are sorry for any inconvenience caused by this message.
