

वास्तविक पैटर्न

पैटर्न ग्राफिकल मॉडल हैं जो चार्ट में मूल्य से बने होते हैं। तकनीकी विश्लेषण भविष्यवाणियों में से एक के अनुसार, इतिहास का मतलब मूल्य आंदोलन खुद को दोहराता है। इसका मतलब है कि मूल्य आंदोलन अक्सर एक ही परिस्थितियों में समान होते हैं जो उच्च संभावना के साथ स्थिति के आगे के विकास की भविष्यवाणी करना संभव बनाता है।
इंस्टा फॉरेक्स द्वारा प्रासंगिक पैटर्न एक उपयोग में आसान सेवा है जो आपको बाजार में नवीनतम परिवर्तनों के बारे में जागरूक होने और समय पर बाजार से संकेतों पर प्रतिक्रिया करने की अनुमति देती है। हमारी सेवा में आप हमेशा किसी भी जोड़ी और किसी भी समय सीमा पर नवीनतम और सबसे प्रासंगिक पैटर्न प्राप्त कर सकते हैं.
Bearish Symmetrical Triangle
was formed on 16.04 at 02:00:48 (UTC+0)
signal strength 1 of 5

According to the chart of M5, NZDJPY formed the Bearish Symmetrical Triangle pattern. Description: The lower border is 84.16/84.34 and upper border is 84.51/84.34. The pattern width is measured on the chart at -35 pips. The formation of the Bearish Symmetrical Triangle pattern evidently signals a continuation of the downward trend. In other words, if the scenario comes true and NZDJPY breaches the lower border, the price could continue its move toward 84.19.
The M5 and M15 time frames may have more false entry points.
See Also
- All
- All
- Bearish Rectangle
- Bearish Symmetrical Triangle
- Bearish Symmetrical Triangle
- Bullish Rectangle
- Double Top
- Double Top
- Triple Bottom
- Triple Bottom
- Triple Top
- Triple Top
- All
- All
- Buy
- Sale
- All
- 1
- 2
- 3
- 4
- 5
डबल टॉप
was formed on 21.04 at 09:05:14 (UTC+0)
signal strength 1 of 5
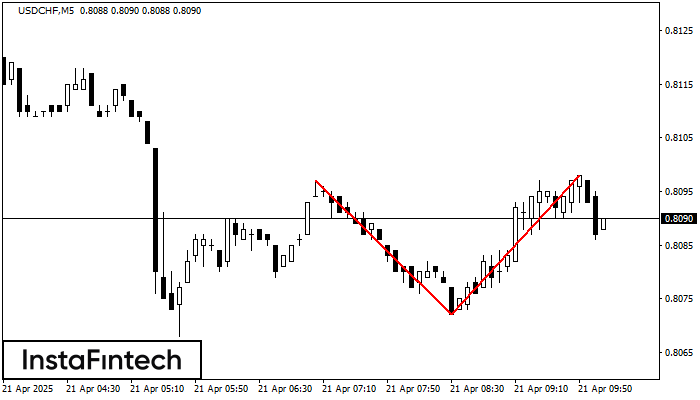
USDCHF M5 के चार्ट पर डबल टॉप रीवर्सल पैटर्न बना है। विशेषताएं: ऊपरी सीमा 0.8098; निचली सीमा 0.8072; पैटर्न की चौड़ाई 26 पॉइंट्स। संकेत: निचली सीमा के टूटने से 0.8057
M5 और M15 समय सीमा में अधिक फाल्स एंट्री पॉइंट्स हो सकते हैं।
Open chart in a new window
बुलिश आयत
was formed on 21.04 at 09:02:17 (UTC+0)
signal strength 1 of 5
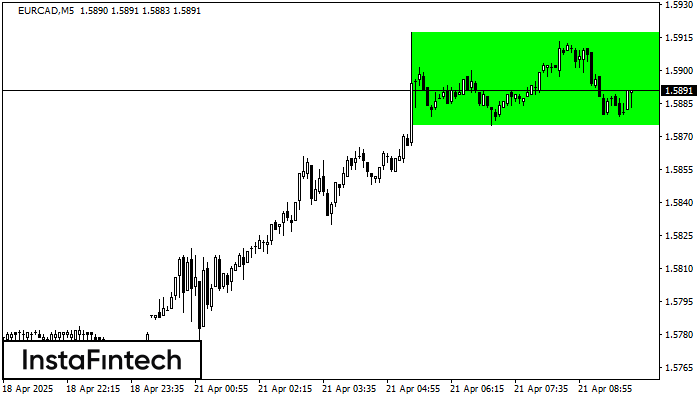
M5 के चार्ट के अनुसार, EURCAD से बुलिश आयत बना जो एक प्रवृत्ति निरंतरता का पैटर्न है। पैटर्न निम्न सीमाओं के भीतर समाहित है: निचली सीमा 1.5875 – 1.5875
M5 और M15 समय सीमा में अधिक फाल्स एंट्री पॉइंट्स हो सकते हैं।
Open chart in a new window
बुलिश सिमेट्रिकल त्रिभुज
was formed on 21.04 at 08:56:47 (UTC+0)
signal strength 1 of 5
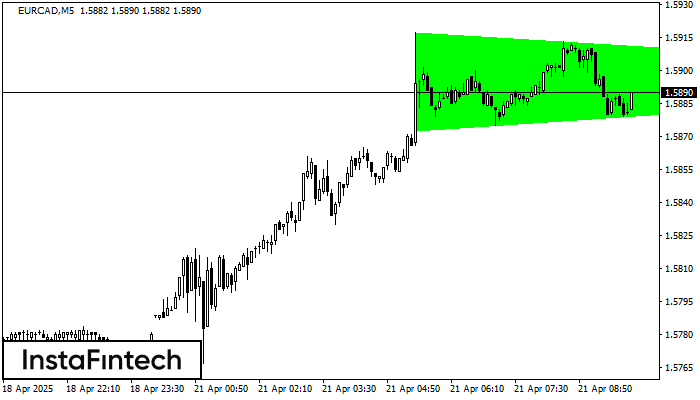
M5 के चार्ट के अनुसार, EURCAD से बुलिश सिमेट्रिकल त्रिभुज पैटर्न बना। विवरण: यह एक ट्रेंड जारी रहने का पैटर्न है। 1.5917 और 1.5872 क्रमशः ऊपरी और निचली सीमाओं के
M5 और M15 समय सीमा में अधिक फाल्स एंट्री पॉइंट्स हो सकते हैं।
Open chart in a new window


