

वास्तविक पैटर्न

पैटर्न ग्राफिकल मॉडल हैं जो चार्ट में मूल्य से बने होते हैं। तकनीकी विश्लेषण भविष्यवाणियों में से एक के अनुसार, इतिहास का मतलब मूल्य आंदोलन खुद को दोहराता है। इसका मतलब है कि मूल्य आंदोलन अक्सर एक ही परिस्थितियों में समान होते हैं जो उच्च संभावना के साथ स्थिति के आगे के विकास की भविष्यवाणी करना संभव बनाता है।
इंस्टा फॉरेक्स द्वारा प्रासंगिक पैटर्न एक उपयोग में आसान सेवा है जो आपको बाजार में नवीनतम परिवर्तनों के बारे में जागरूक होने और समय पर बाजार से संकेतों पर प्रतिक्रिया करने की अनुमति देती है। हमारी सेवा में आप हमेशा किसी भी जोड़ी और किसी भी समय सीमा पर नवीनतम और सबसे प्रासंगिक पैटर्न प्राप्त कर सकते हैं.
Triple Top
was formed on 01.04 at 18:30:11 (UTC+0)
signal strength 1 of 5
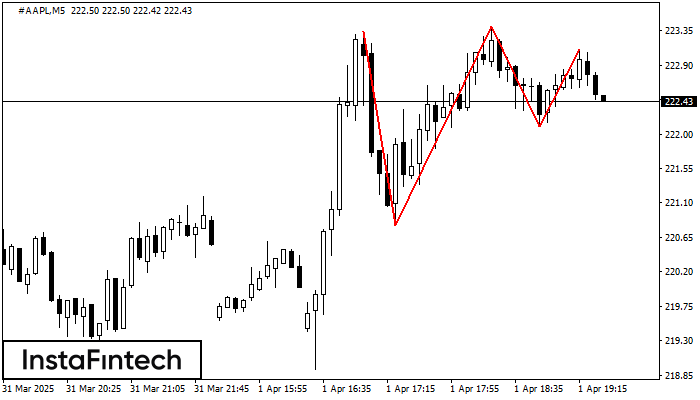
The Triple Top pattern has formed on the chart of the #AAPL M5. Features of the pattern: borders have an ascending angle; the lower line of the pattern has the coordinates 220.81/222.10 with the upper limit 223.34/223.11; the projection of the width is 253 points. The formation of the Triple Top figure most likely indicates a change in the trend from upward to downward. This means that in the event of a breakdown of the support level of 220.81, the price is most likely to continue the downward movement.
The M5 and M15 time frames may have more false entry points.
- All
- All
- Bearish Rectangle
- Bearish Symmetrical Triangle
- Bearish Symmetrical Triangle
- Bullish Rectangle
- Double Top
- Double Top
- Triple Bottom
- Triple Bottom
- Triple Top
- Triple Top
- All
- All
- Buy
- Sale
- All
- 1
- 2
- 3
- 4
- 5
Triple Bottom
was formed on 20.04 at 23:32:42 (UTC+0)
signal strength 3 of 5

Corak Triple Bottom telah dibentuk pada carta AUDCHF M30. Ciri-ciri corak: Garisan bawah corak mempunyai koordinat 0.5232 dengan had atas 0.5232/0.5218, unjuran lebar adalah 26 mata. Pembentukan corak Triple Bottom
Open chart in a new window
Double Top
was formed on 20.04 at 23:10:07 (UTC+0)
signal strength 1 of 5

Corak pembalikan Double Top telah dibentuk pada #Bitcoin M5. Ciri-ciri: sempadan atas %P0.000000; sempadan bawah 85197.81; sempadan bawah 84993.66; lebar corak adalah 23229 mata. Dagangan menjual adalah lebih baik untuk
Carta masa M5 dan M15 mungkin mempunyai lebih banyak titik kemasukan palsu.
Open chart in a new window
Segi Empat Menurun
was formed on 20.04 at 19:17:25 (UTC+0)
signal strength 1 of 5

Berdasarkan carta M5, #Bitcoin telah membentuk Segi Empat Menurun yang merupakan corak kesinambungan aliran. Corak terkandung dalam sempadan berikut: sempadan bawah 84213.45 – 84213.45 dan sempadan atas 84636.40 – 84636.40
Carta masa M5 dan M15 mungkin mempunyai lebih banyak titik kemasukan palsu.
Open chart in a new window


