

वास्तविक पैटर्न

पैटर्न ग्राफिकल मॉडल हैं जो चार्ट में मूल्य से बने होते हैं। तकनीकी विश्लेषण भविष्यवाणियों में से एक के अनुसार, इतिहास का मतलब मूल्य आंदोलन खुद को दोहराता है। इसका मतलब है कि मूल्य आंदोलन अक्सर एक ही परिस्थितियों में समान होते हैं जो उच्च संभावना के साथ स्थिति के आगे के विकास की भविष्यवाणी करना संभव बनाता है।
इंस्टा फॉरेक्स द्वारा प्रासंगिक पैटर्न एक उपयोग में आसान सेवा है जो आपको बाजार में नवीनतम परिवर्तनों के बारे में जागरूक होने और समय पर बाजार से संकेतों पर प्रतिक्रिया करने की अनुमति देती है। हमारी सेवा में आप हमेशा किसी भी जोड़ी और किसी भी समय सीमा पर नवीनतम और सबसे प्रासंगिक पैटर्न प्राप्त कर सकते हैं.
Bullish pennant
was formed on 31.03 at 16:18:54 (UTC+0)
signal strength 1 of 5
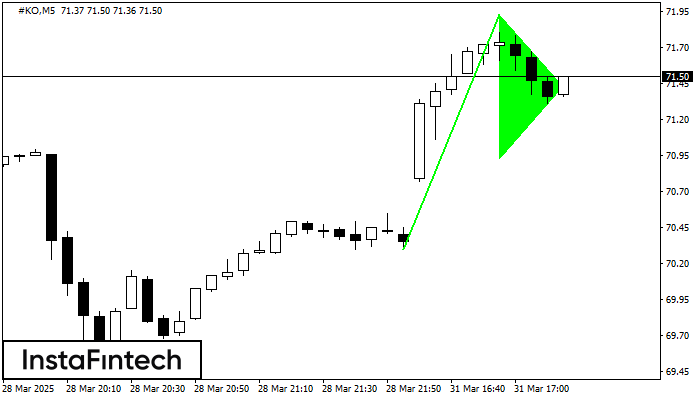
The Bullish pennant signal – Trading instrument #KO M5, continuation pattern. Forecast: it is possible to set up a buy position above the pattern’s high of 71.93, with the prospect of the next move being a projection of the flagpole height.
The M5 and M15 time frames may have more false entry points.
See Also
- All
- All
- Bearish Rectangle
- Bearish Symmetrical Triangle
- Bearish Symmetrical Triangle
- Bullish Rectangle
- Double Top
- Double Top
- Triple Bottom
- Triple Bottom
- Triple Top
- Triple Top
- All
- All
- Buy
- Sale
- All
- 1
- 2
- 3
- 4
- 5
Triple Top
was formed on 22.04 at 02:00:16 (UTC+0)
signal strength 3 of 5

The Triple Top pattern has formed on the chart of the EURCAD M30 trading instrument. It is a reversal pattern featuring the following characteristics: resistance level 14, support level -60
Open chart in a new window
Bullish Symmetrical Triangle
was formed on 22.04 at 01:47:45 (UTC+0)
signal strength 2 of 5

According to the chart of M15, USDCAD formed the Bullish Symmetrical Triangle pattern, which signals the trend will continue. Description. The upper border of the pattern touches the coordinates 1.3848/1.3836
The M5 and M15 time frames may have more false entry points.
Open chart in a new window
Bullish Symmetrical Triangle
was formed on 22.04 at 01:45:28 (UTC+0)
signal strength 2 of 5

According to the chart of M15, NZDJPY formed the Bullish Symmetrical Triangle pattern. Description: This is the pattern of a trend continuation. 84.73 and 84.17 are the coordinates
The M5 and M15 time frames may have more false entry points.
Open chart in a new window


