

वास्तविक पैटर्न

पैटर्न ग्राफिकल मॉडल हैं जो चार्ट में मूल्य से बने होते हैं। तकनीकी विश्लेषण भविष्यवाणियों में से एक के अनुसार, इतिहास का मतलब मूल्य आंदोलन खुद को दोहराता है। इसका मतलब है कि मूल्य आंदोलन अक्सर एक ही परिस्थितियों में समान होते हैं जो उच्च संभावना के साथ स्थिति के आगे के विकास की भविष्यवाणी करना संभव बनाता है।
इंस्टा फॉरेक्स द्वारा प्रासंगिक पैटर्न एक उपयोग में आसान सेवा है जो आपको बाजार में नवीनतम परिवर्तनों के बारे में जागरूक होने और समय पर बाजार से संकेतों पर प्रतिक्रिया करने की अनुमति देती है। हमारी सेवा में आप हमेशा किसी भी जोड़ी और किसी भी समय सीमा पर नवीनतम और सबसे प्रासंगिक पैटर्न प्राप्त कर सकते हैं.
Double Bottom
was formed on 31.03 at 13:30:19 (UTC+0)
signal strength 3 of 5
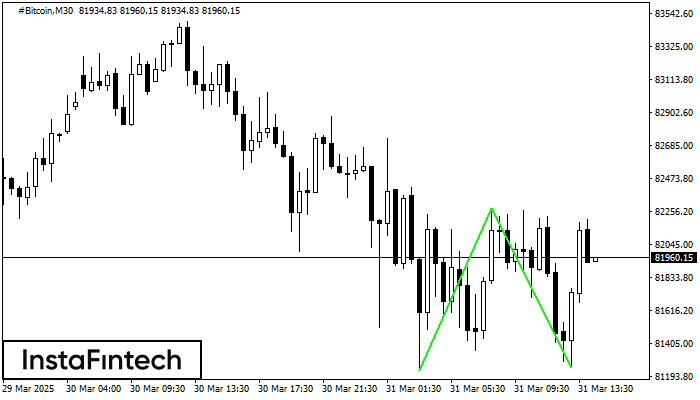
The Double Bottom pattern has been formed on #Bitcoin M30. This formation signals a reversal of the trend from downwards to upwards. The signal is that a buy trade should be opened after the upper boundary of the pattern 82275.64 is broken. The further movements will rely on the width of the current pattern 104454 points.
See Also
- All
- All
- Bearish Rectangle
- Bearish Symmetrical Triangle
- Bearish Symmetrical Triangle
- Bullish Rectangle
- Double Top
- Double Top
- Triple Bottom
- Triple Bottom
- Triple Top
- Triple Top
- All
- All
- Buy
- Sale
- All
- 1
- 2
- 3
- 4
- 5
Double Top
сформирован 21.04 в 15:59:58 (UTC+0)
сила сигнала 2 из 5
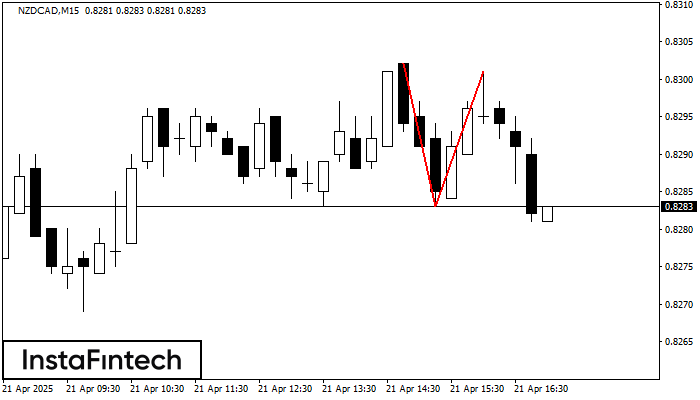
The Double Top pattern has been formed on NZDCAD M15. It signals that the trend has been changed from upwards to downwards. Probably, if the base of the pattern 0.8283
The M5 and M15 time frames may have more false entry points.
Открыть график инструмента в новом окне
Bullish Symmetrical Triangle
сформирован 21.04 в 15:33:18 (UTC+0)
сила сигнала 2 из 5

According to the chart of M15, #Bitcoin formed the Bullish Symmetrical Triangle pattern. Description: This is the pattern of a trend continuation. 87754.54 and 86429.29 are the coordinates
The M5 and M15 time frames may have more false entry points.
Открыть график инструмента в новом окне
Double Bottom
сформирован 21.04 в 15:29:52 (UTC+0)
сила сигнала 3 из 5

The Double Bottom pattern has been formed on GBPCHF M30. This formation signals a reversal of the trend from downwards to upwards. The signal is that a buy trade should
Открыть график инструмента в новом окне


