

वास्तविक पैटर्न

पैटर्न ग्राफिकल मॉडल हैं जो चार्ट में मूल्य से बने होते हैं। तकनीकी विश्लेषण भविष्यवाणियों में से एक के अनुसार, इतिहास का मतलब मूल्य आंदोलन खुद को दोहराता है। इसका मतलब है कि मूल्य आंदोलन अक्सर एक ही परिस्थितियों में समान होते हैं जो उच्च संभावना के साथ स्थिति के आगे के विकास की भविष्यवाणी करना संभव बनाता है।
इंस्टा फॉरेक्स द्वारा प्रासंगिक पैटर्न एक उपयोग में आसान सेवा है जो आपको बाजार में नवीनतम परिवर्तनों के बारे में जागरूक होने और समय पर बाजार से संकेतों पर प्रतिक्रिया करने की अनुमति देती है। हमारी सेवा में आप हमेशा किसी भी जोड़ी और किसी भी समय सीमा पर नवीनतम और सबसे प्रासंगिक पैटर्न प्राप्त कर सकते हैं.
Head and Shoulders
was formed on 31.03 at 08:30:15 (UTC+0)
signal strength 2 of 5
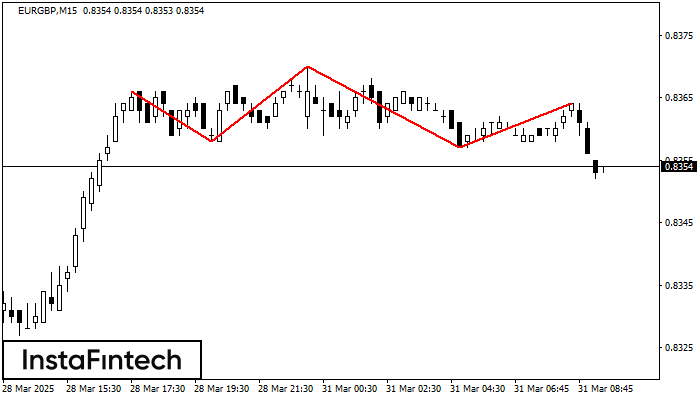
According to the chart of M15, EURGBP formed the Head and Shoulders pattern. The Head’s top is set at 0.8370 while the median line of the Neck is found at 0.8358/0.8357. The formation of the Head and Shoulders pattern evidently signals a reversal of the upward trend. In other words, in case the scenario comes true, the price of EURGBP will go towards 0.8335.
The M5 and M15 time frames may have more false entry points.
See Also
- All
- All
- Bearish Rectangle
- Bearish Symmetrical Triangle
- Bearish Symmetrical Triangle
- Bullish Rectangle
- Double Top
- Double Top
- Triple Bottom
- Triple Bottom
- Triple Top
- Triple Top
- All
- All
- Buy
- Sale
- All
- 1
- 2
- 3
- 4
- 5
बियरिश सिमेट्रिकल त्रिभुज
was formed on 21.04 at 13:48:33 (UTC+0)
signal strength 2 of 5
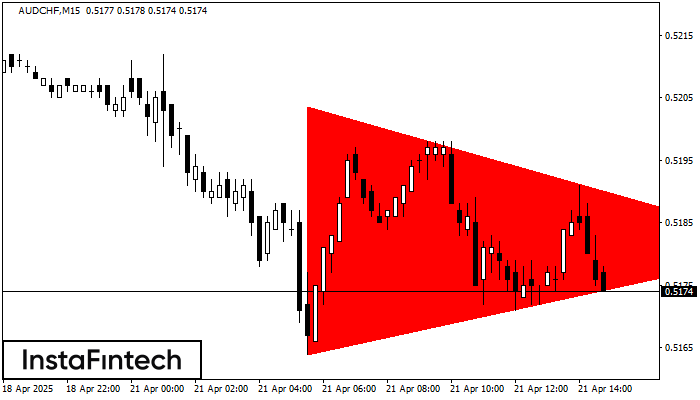
M15 के चार्ट के अनुसार, AUDCHF से बियरिश सिमेट्रिकल त्रिभुज पैटर्न बना। निचली सीमा 0.5164 भंग होने की स्थिति में यह पैटर्न और नीचे के ट्रेंड की ओर संकेत करता
M5 और M15 समय सीमा में अधिक फाल्स एंट्री पॉइंट्स हो सकते हैं।
Open chart in a new window
बियरिश सिमेट्रिकल त्रिभुज
was formed on 21.04 at 13:29:27 (UTC+0)
signal strength 1 of 5

M5 के चार्ट के अनुसार, AUDCHF से बियरिश सिमेट्रिकल त्रिभुज पैटर्न बना। विवरण: निचली सीमा 0.5164/0.5181 है और ऊपरी सीमा 0.5203/0.5181 है। पैटर्न की चौड़ाई चार्ट पर -39 पिप्स
M5 और M15 समय सीमा में अधिक फाल्स एंट्री पॉइंट्स हो सकते हैं।
Open chart in a new window
ट्रिपल टॉप
was formed on 21.04 at 12:40:05 (UTC+0)
signal strength 1 of 5

GOLD M5 ट्रेडिंग इंस्ट्रूमेंट के चार्ट पर, ट्रिपल टॉप पैटर्न जो एक प्रवृत्ति परिवर्तन का संकेत देता है, बना है। यह संभव है कि तीसरी चोटी के गठन के बाद
M5 और M15 समय सीमा में अधिक फाल्स एंट्री पॉइंट्स हो सकते हैं।
Open chart in a new window


