

वास्तविक पैटर्न

पैटर्न ग्राफिकल मॉडल हैं जो चार्ट में मूल्य से बने होते हैं। तकनीकी विश्लेषण भविष्यवाणियों में से एक के अनुसार, इतिहास का मतलब मूल्य आंदोलन खुद को दोहराता है। इसका मतलब है कि मूल्य आंदोलन अक्सर एक ही परिस्थितियों में समान होते हैं जो उच्च संभावना के साथ स्थिति के आगे के विकास की भविष्यवाणी करना संभव बनाता है।
इंस्टा फॉरेक्स द्वारा प्रासंगिक पैटर्न एक उपयोग में आसान सेवा है जो आपको बाजार में नवीनतम परिवर्तनों के बारे में जागरूक होने और समय पर बाजार से संकेतों पर प्रतिक्रिया करने की अनुमति देती है। हमारी सेवा में आप हमेशा किसी भी जोड़ी और किसी भी समय सीमा पर नवीनतम और सबसे प्रासंगिक पैटर्न प्राप्त कर सकते हैं.
Bullish Rectangle
was formed on 27.03 at 22:46:39 (UTC+0)
signal strength 2 of 5
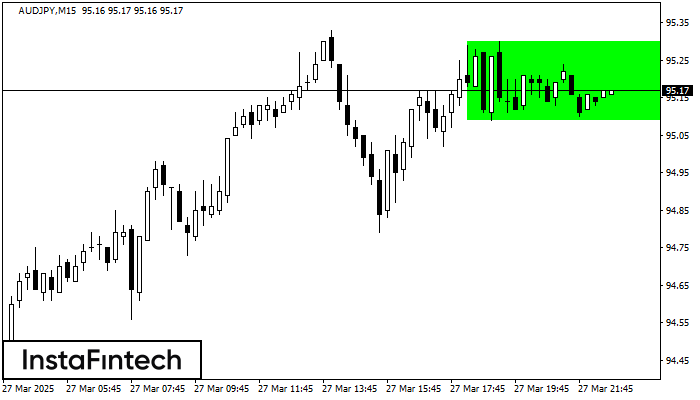
According to the chart of M15, AUDJPY formed the Bullish Rectangle. The pattern indicates a trend continuation. The upper border is 95.30, the lower border is 95.09. The signal means that a long position should be opened above the upper border 95.30 of the Bullish Rectangle.
The M5 and M15 time frames may have more false entry points.
See Also
- All
- All
- Bearish Rectangle
- Bearish Symmetrical Triangle
- Bearish Symmetrical Triangle
- Bullish Rectangle
- Double Top
- Double Top
- Triple Bottom
- Triple Bottom
- Triple Top
- Triple Top
- All
- All
- Buy
- Sale
- All
- 1
- 2
- 3
- 4
- 5
Triple Top
was formed on 09.04 at 11:59:50 (UTC+0)
signal strength 1 of 5
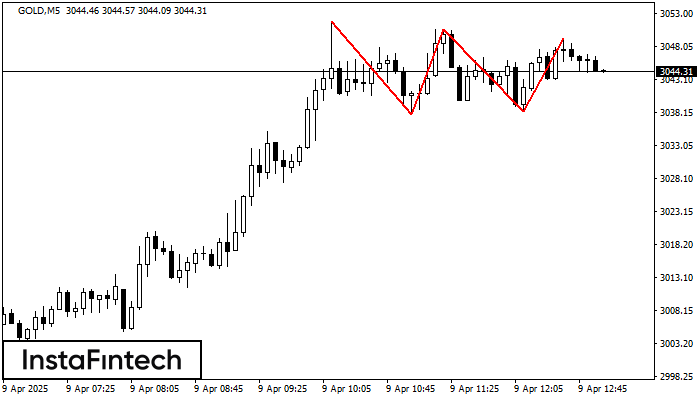
On the chart of the GOLD M5 trading instrument, the Triple Top pattern that signals a trend change has formed. It is possible that after formation of the third peak
The M5 and M15 time frames may have more false entry points.
Open chart in a new window
Bullish Symmetrical Triangle
was formed on 09.04 at 11:56:23 (UTC+0)
signal strength 1 of 5
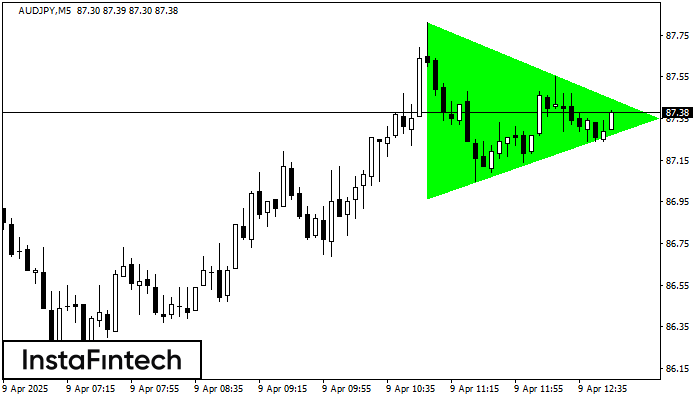
According to the chart of M5, AUDJPY formed the Bullish Symmetrical Triangle pattern, which signals the trend will continue. Description. The upper border of the pattern touches the coordinates 87.81/87.35
The M5 and M15 time frames may have more false entry points.
Open chart in a new window
Triple Top
was formed on 09.04 at 11:34:58 (UTC+0)
signal strength 1 of 5

On the chart of the NZDUSD M5 trading instrument, the Triple Top pattern that signals a trend change has formed. It is possible that after formation of the third peak
The M5 and M15 time frames may have more false entry points.
Open chart in a new window


