

वास्तविक पैटर्न

पैटर्न ग्राफिकल मॉडल हैं जो चार्ट में मूल्य से बने होते हैं। तकनीकी विश्लेषण भविष्यवाणियों में से एक के अनुसार, इतिहास का मतलब मूल्य आंदोलन खुद को दोहराता है। इसका मतलब है कि मूल्य आंदोलन अक्सर एक ही परिस्थितियों में समान होते हैं जो उच्च संभावना के साथ स्थिति के आगे के विकास की भविष्यवाणी करना संभव बनाता है।
इंस्टा फॉरेक्स द्वारा प्रासंगिक पैटर्न एक उपयोग में आसान सेवा है जो आपको बाजार में नवीनतम परिवर्तनों के बारे में जागरूक होने और समय पर बाजार से संकेतों पर प्रतिक्रिया करने की अनुमति देती है। हमारी सेवा में आप हमेशा किसी भी जोड़ी और किसी भी समय सीमा पर नवीनतम और सबसे प्रासंगिक पैटर्न प्राप्त कर सकते हैं.
Double Bottom
was formed on 25.03 at 02:55:11 (UTC+0)
signal strength 1 of 5
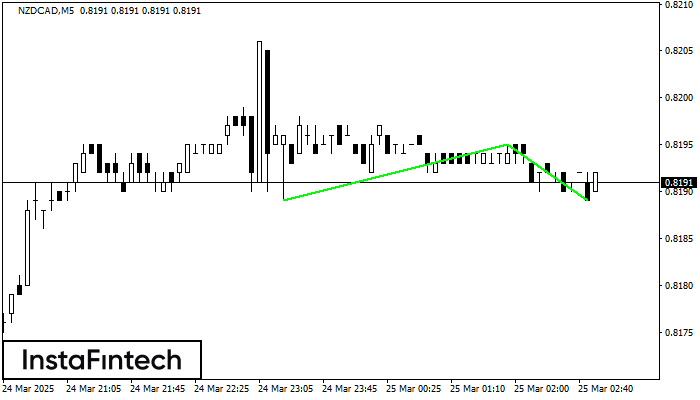
The Double Bottom pattern has been formed on NZDCAD M5; the upper boundary is 0.8195; the lower boundary is 0.8189. The width of the pattern is 6 points. In case of a break of the upper boundary 0.8195, a change in the trend can be predicted where the width of the pattern will coincide with the distance to a possible take profit level.
The M5 and M15 time frames may have more false entry points.
- All
- All
- Bearish Rectangle
- Bearish Symmetrical Triangle
- Bearish Symmetrical Triangle
- Bullish Rectangle
- Double Top
- Double Top
- Triple Bottom
- Triple Bottom
- Triple Top
- Triple Top
- All
- All
- Buy
- Sale
- All
- 1
- 2
- 3
- 4
- 5
Head and Shoulders
was formed on 31.03 at 08:40:22 (UTC+0)
signal strength 1 of 5

According to the chart of M5, GBPAUD formed the Head and Shoulders pattern. The Head’s top is set at 2.0644 while the median line of the Neck is found
The M5 and M15 time frames may have more false entry points.
Open chart in a new window
Triple Top
was formed on 31.03 at 08:30:26 (UTC+0)
signal strength 3 of 5

The Triple Top pattern has formed on the chart of the EURCAD M30. Features of the pattern: borders have an ascending angle; the lower line of the pattern
Open chart in a new window
Head and Shoulders
was formed on 31.03 at 08:30:17 (UTC+0)
signal strength 3 of 5

The technical pattern called Head and Shoulders has appeared on the chart of EURGBP M30. There are weighty reasons to suggest that the price will surpass the Neckline 0.8358/0.8357 after
Open chart in a new window


