

Pola sebenarnya

Bearish pennant
was formed on 02.04 at 18:35:58 (UTC+0)
signal strength 1 of 5
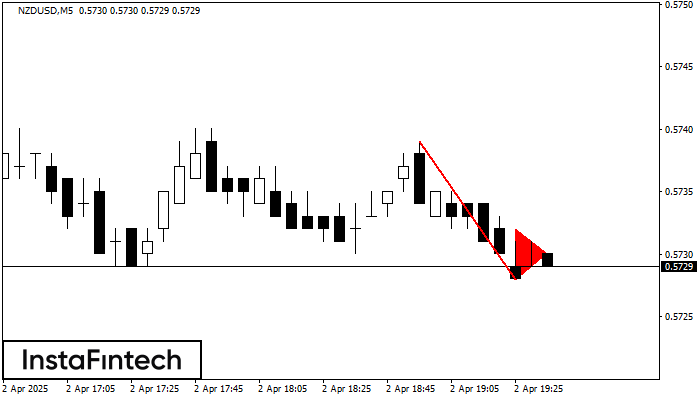
The Bearish pennant pattern has formed on the NZDUSD M5 chart. The pattern signals continuation of the downtrend in case the pennant’s low of 0.5728 is broken through. Recommendations: Place the sell stop pending order 10 pips below the pattern’s low. Place the take profit order at the projection distance of the flagpole height.
The M5 and M15 time frames may have more false entry points.
Lihat juga
- All
- All
- Bearish Rectangle
- Bearish Symmetrical Triangle
- Bearish Symmetrical Triangle
- Bullish Rectangle
- Double Top
- Double Top
- Triple Bottom
- Triple Bottom
- Triple Top
- Triple Top
- All
- All
- Buy
- Sale
- All
- 1
- 2
- 3
- 4
- 5
Triple Top
сформирован 23.04 в 02:30:18 (UTC+0)
сила сигнала 1 из 5

The Triple Top pattern has formed on the chart of the #Bitcoin M5. Features of the pattern: borders have an ascending angle; the lower line of the pattern
The M5 and M15 time frames may have more false entry points.
Открыть график инструмента в новом окне
Triple Top
сформирован 23.04 в 02:15:05 (UTC+0)
сила сигнала 1 из 5

On the chart of the AUDJPY M5 trading instrument, the Triple Top pattern that signals a trend change has formed. It is possible that after formation of the third peak
The M5 and M15 time frames may have more false entry points.
Открыть график инструмента в новом окне
Double Top
сформирован 23.04 в 02:15:05 (UTC+0)
сила сигнала 1 из 5
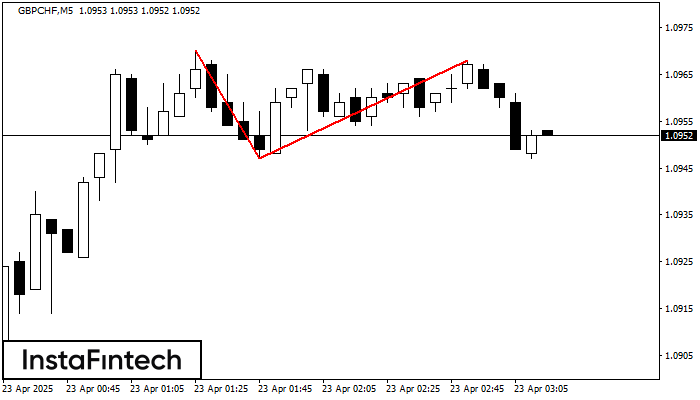
On the chart of GBPCHF M5 the Double Top reversal pattern has been formed. Characteristics: the upper boundary 1.0968; the lower boundary 1.0947; the width of the pattern 21 points
The M5 and M15 time frames may have more false entry points.
Открыть график инструмента в новом окне


