

Pola sebenarnya

Double Bottom
was formed on 02.04 at 00:00:26 (UTC+0)
signal strength 3 of 5
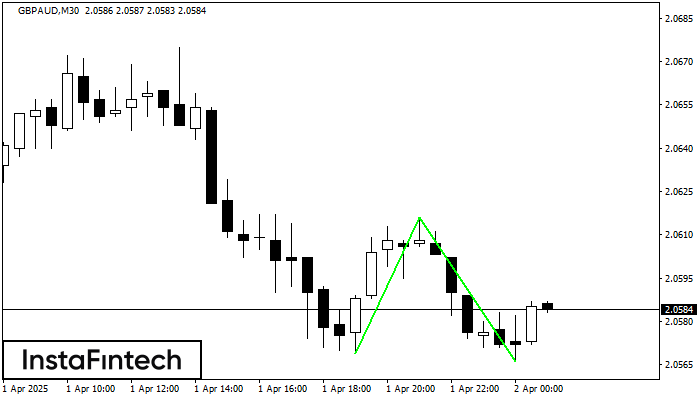
The Double Bottom pattern has been formed on GBPAUD M30; the upper boundary is 2.0616; the lower boundary is 2.0566. The width of the pattern is 47 points. In case of a break of the upper boundary 2.0616, a change in the trend can be predicted where the width of the pattern will coincide with the distance to a possible take profit level.
Lihat juga
- All
- All
- Bearish Rectangle
- Bearish Symmetrical Triangle
- Bearish Symmetrical Triangle
- Bullish Rectangle
- Double Top
- Double Top
- Triple Bottom
- Triple Bottom
- Triple Top
- Triple Top
- All
- All
- Buy
- Sale
- All
- 1
- 2
- 3
- 4
- 5
Bearish pennant
сформирован 21.04 в 16:59:58 (UTC+0)
сила сигнала 2 из 5
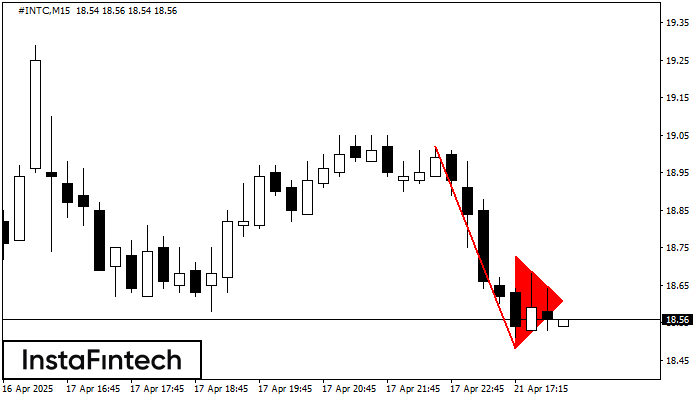
The Bearish pennant pattern has formed on the #INTC M15 chart. This pattern type is characterized by a slight slowdown after which the price will move in the direction
The M5 and M15 time frames may have more false entry points.
Открыть график инструмента в новом окне
Bearish pennant
сформирован 21.04 в 16:59:49 (UTC+0)
сила сигнала 2 из 5
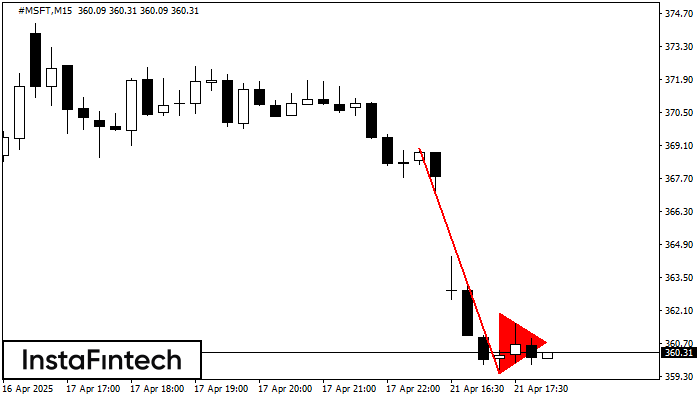
The Bearish pennant pattern has formed on the #MSFT M15 chart. The pattern signals continuation of the downtrend in case the pennant’s low of 359.45 is broken through. Recommendations: Place
The M5 and M15 time frames may have more false entry points.
Открыть график инструмента в новом окне
Bearish Flag
сформирован 21.04 в 16:51:21 (UTC+0)
сила сигнала 2 из 5
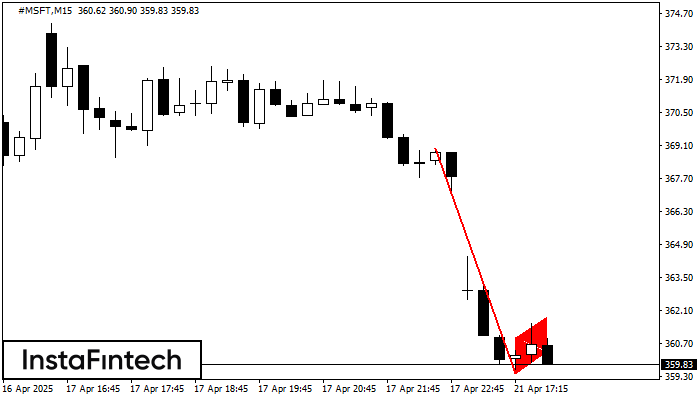
The Bearish Flag pattern has been formed on the chart #MSFT M15 which signals that the downward trend will continue. If the price breaks below the low at 359.45, then
The M5 and M15 time frames may have more false entry points.
Открыть график инструмента в новом окне


