

Pola sebenarnya

Bullish Symmetrical Triangle
was formed on 31.03 at 17:20:29 (UTC+0)
signal strength 1 of 5
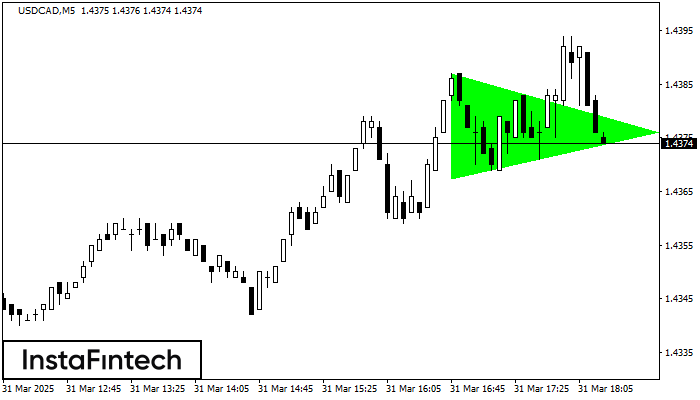
According to the chart of M5, USDCAD formed the Bullish Symmetrical Triangle pattern. Description: This is the pattern of a trend continuation. 1.4387 and 1.4367 are the coordinates of the upper and lower borders respectively. The pattern width is measured on the chart at 20 pips. Outlook: If the upper border 1.4387 is broken, the price is likely to continue its move by 1.4391.
The M5 and M15 time frames may have more false entry points.
Lihat juga
- All
- All
- Bearish Rectangle
- Bearish Symmetrical Triangle
- Bearish Symmetrical Triangle
- Bullish Rectangle
- Double Top
- Double Top
- Triple Bottom
- Triple Bottom
- Triple Top
- Triple Top
- All
- All
- Buy
- Sale
- All
- 1
- 2
- 3
- 4
- 5
Bawah Triple
was formed on 20.04 at 23:32:42 (UTC+0)
signal strength 3 of 5

Pola Bawah Triple telah terbentuk pada grafik AUDCHF M30. Fitur-fitur pola: garis bawah pola memiliki koordinat 0.5232 dengan batas atas 0.5232/0.5218, proyeksi lebar adalah 26 poin. Pembentukan pola Bawah Triple
Open chart in a new window
Teratas Ganda
was formed on 20.04 at 23:10:07 (UTC+0)
signal strength 1 of 5

Pola reversal Teratas Ganda telah terbentuk pada #Bitcoin M5. Karakteristik: batas atas 85197.81; batas bawah 84993.66; lebar pola 23229 poin. Transaksi jual lebih baik dibuka di bawah batas bawah 84993.66
Rangka waktu M5 dan M15 mungkin memiliki lebih dari titik entri yang keliru.
Open chart in a new window
Persegi Bearish
was formed on 20.04 at 19:17:25 (UTC+0)
signal strength 1 of 5

Menurut grafik dari M5, #Bitcoin terbentuk Persegi Bearish yang merupakan pola dari kelanjutan tren. Pola terkandung di dalam batas berikut: batas lebih rendah 84213.45 – 84213.45 dan batas atas 84636.40
Rangka waktu M5 dan M15 mungkin memiliki lebih dari titik entri yang keliru.
Open chart in a new window


