

Pola sebenarnya

Bearish Symmetrical Triangle
was formed on 31.03 at 14:11:15 (UTC+0)
signal strength 1 of 5
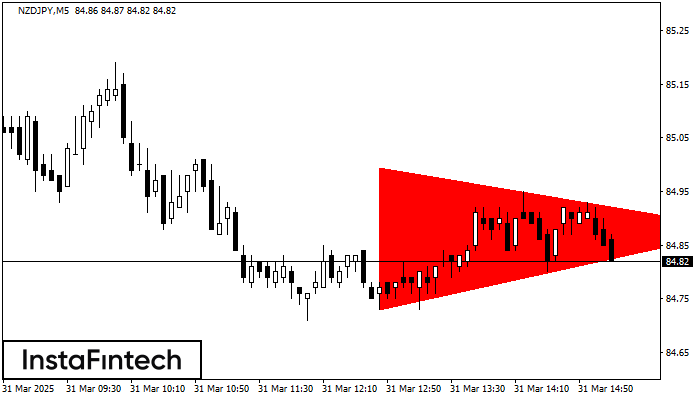
According to the chart of M5, NZDJPY formed the Bearish Symmetrical Triangle pattern. Trading recommendations: A breach of the lower border 84.73 is likely to encourage a continuation of the downward trend.
The M5 and M15 time frames may have more false entry points.
Lihat juga
- All
- All
- Bearish Rectangle
- Bearish Symmetrical Triangle
- Bearish Symmetrical Triangle
- Bullish Rectangle
- Double Top
- Double Top
- Triple Bottom
- Triple Bottom
- Triple Top
- Triple Top
- All
- All
- Buy
- Sale
- All
- 1
- 2
- 3
- 4
- 5
Segitiga Simetris Bullish
was formed on 16.04 at 11:55:29 (UTC+0)
signal strength 1 of 5
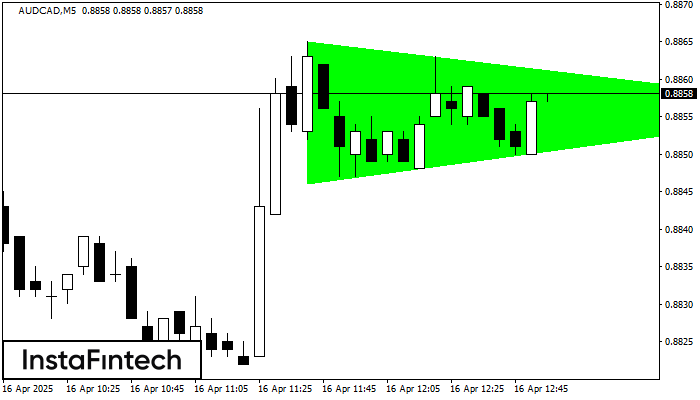
Menurut Grafik dari M5, AUDCAD dibentuk pola Segitiga Simetris Bullish, yang menunjukkan tren akan berlanjut. Deksripsi. Batas atas dari pola menyentuh kordinat 0.8865/0.8856 dimana batas yang lebih rendah berada sepanjang
Rangka waktu M5 dan M15 mungkin memiliki lebih dari titik entri yang keliru.
Open chart in a new window
Bawah Ganda
was formed on 16.04 at 11:45:26 (UTC+0)
signal strength 1 of 5
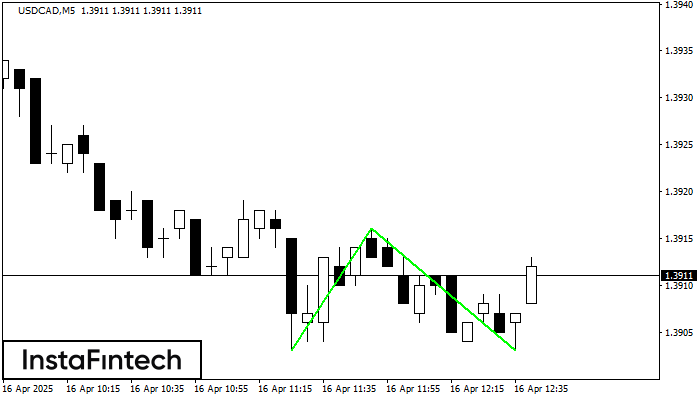
Pola Bawah Ganda telah terbentuk pada USDCAD M5; batas atas di 1.3916; batas bawah di 1.3903. Lebar pola sebesar 13 poin. Jika harga menembus batas atas 1.3916, Perubahan dalam tren
Rangka waktu M5 dan M15 mungkin memiliki lebih dari titik entri yang keliru.
Open chart in a new window
Bawah Ganda
was formed on 16.04 at 11:00:11 (UTC+0)
signal strength 3 of 5
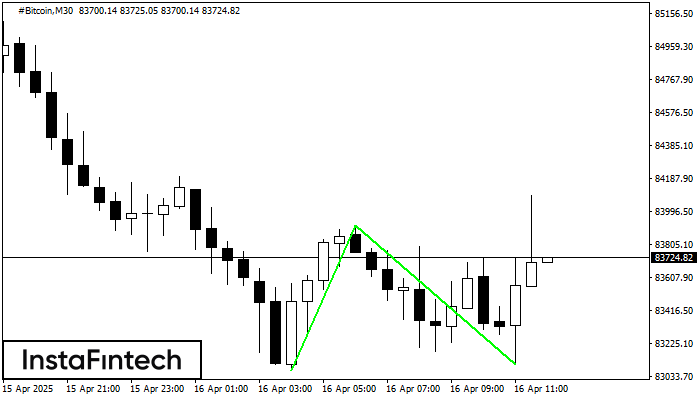
Pola Bawah Ganda telah terbentuk pada #Bitcoin M30; batas atas di 83915.56; batas bawah di 83100.24. Lebar pola sebesar 84817 poin. Jika harga menembus batas atas 83915.56, Perubahan dalam tren
Open chart in a new window


