

Pola sebenarnya

Bullish Symmetrical Triangle
was formed on 27.03 at 23:09:03 (UTC+0)
signal strength 3 of 5

According to the chart of M30, AUDCHF formed the Bullish Symmetrical Triangle pattern, which signals the trend will continue. Description. The upper border of the pattern touches the coordinates 0.5593/0.5568 whereas the lower border goes across 0.5548/0.5568. The pattern width is measured on the chart at 45 pips. If the Bullish Symmetrical Triangle pattern is in progress during the upward trend, this indicates the current trend will go on. In case 0.5568 is broken, the price could continue its move toward 0.5598.
Lihat juga
- All
- All
- Bearish Rectangle
- Bearish Symmetrical Triangle
- Bearish Symmetrical Triangle
- Bullish Rectangle
- Double Top
- Double Top
- Triple Bottom
- Triple Bottom
- Triple Top
- Triple Top
- All
- All
- Buy
- Sale
- All
- 1
- 2
- 3
- 4
- 5
Bullish Symmetrical Triangle
was formed on 16.04 at 06:40:55 (UTC+0)
signal strength 2 of 5

According to the chart of M15, AUDCAD formed the Bullish Symmetrical Triangle pattern. The lower border of the pattern touches the coordinates 0.8813/0.8844 whereas the upper border goes across 0.8874/0.8844
The M5 and M15 time frames may have more false entry points.
Open chart in a new window
Double Bottom
was formed on 16.04 at 06:31:16 (UTC+0)
signal strength 2 of 5
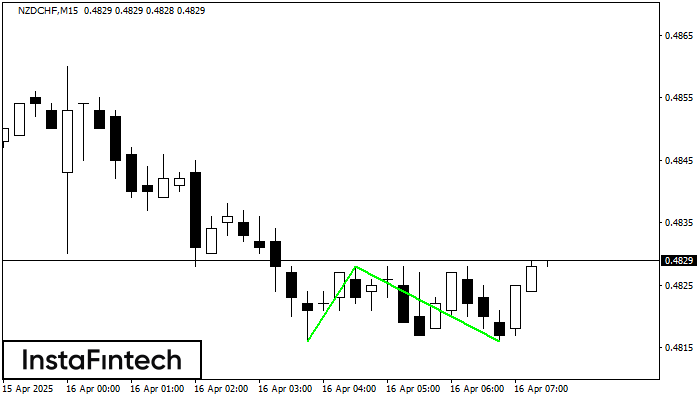
The Double Bottom pattern has been formed on NZDCHF M15; the upper boundary is 0.4828; the lower boundary is 0.4816. The width of the pattern is 12 points. In case
The M5 and M15 time frames may have more false entry points.
Open chart in a new window
Bearish Rectangle
was formed on 16.04 at 05:35:30 (UTC+0)
signal strength 1 of 5
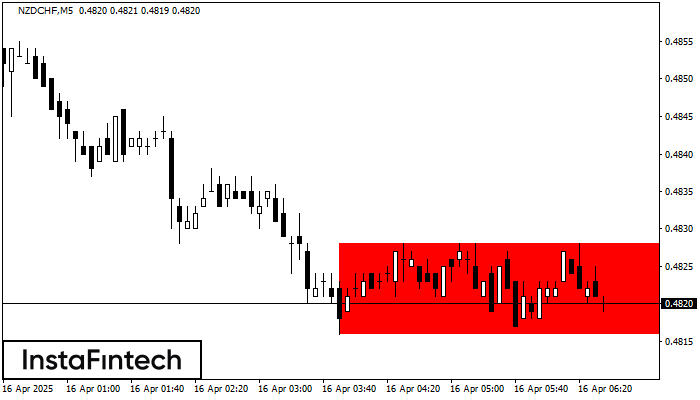
According to the chart of M5, NZDCHF formed the Bearish Rectangle. This type of a pattern indicates a trend continuation. It consists of two levels: resistance 0.4828 - 0.0000
The M5 and M15 time frames may have more false entry points.
Open chart in a new window


