

Pola sebenarnya

Triple Bottom
was formed on 26.03 at 11:55:30 (UTC+0)
signal strength 1 of 5
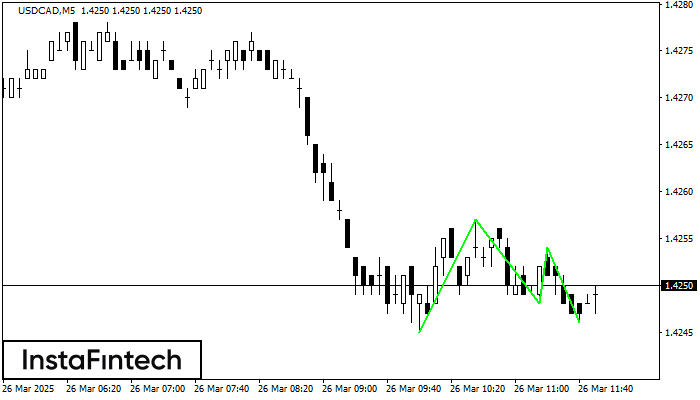
The Triple Bottom pattern has formed on the chart of USDCAD M5. Features of the pattern: The lower line of the pattern has coordinates 1.4257 with the upper limit 1.4257/1.4254, the projection of the width is 12 points. The formation of the Triple Bottom pattern most likely indicates a change in the trend from downward to upward. This means that in the event of a breakdown of the resistance level 1.4245, the price is most likely to continue the upward movement.
The M5 and M15 time frames may have more false entry points.
Lihat juga
- All
- All
- Bearish Rectangle
- Bearish Symmetrical Triangle
- Bearish Symmetrical Triangle
- Bullish Rectangle
- Double Top
- Double Top
- Triple Bottom
- Triple Bottom
- Triple Top
- Triple Top
- All
- All
- Buy
- Sale
- All
- 1
- 2
- 3
- 4
- 5
Double Bottom
was formed on 09.04 at 05:25:03 (UTC+0)
signal strength 1 of 5
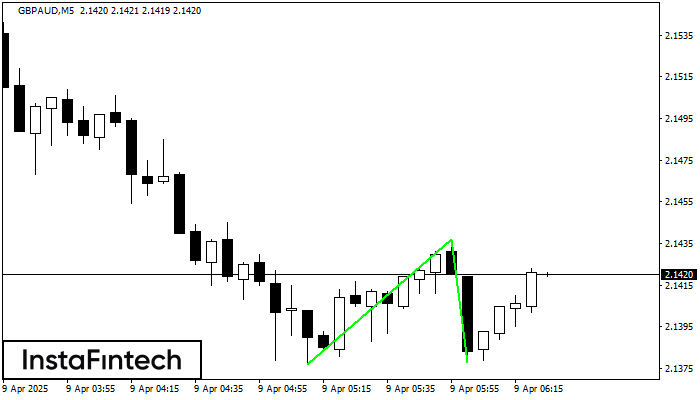
The Double Bottom pattern has been formed on GBPAUD M5. This formation signals a reversal of the trend from downwards to upwards. The signal is that a buy trade should
The M5 and M15 time frames may have more false entry points.
Open chart in a new window
Bullish Rectangle
was formed on 09.04 at 05:02:18 (UTC+0)
signal strength 1 of 5
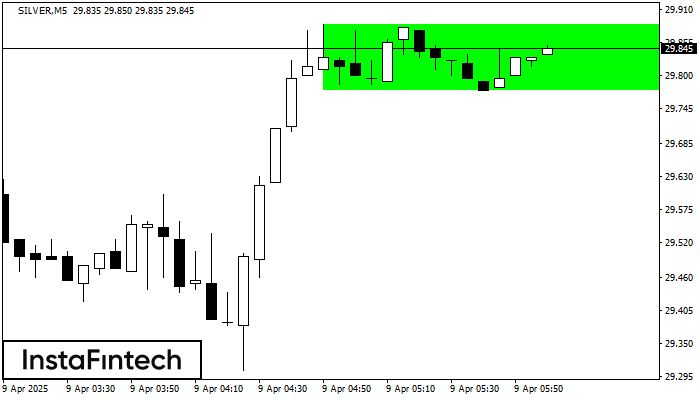
According to the chart of M5, SILVER formed the Bullish Rectangle which is a pattern of a trend continuation. The pattern is contained within the following borders: the lower border
The M5 and M15 time frames may have more false entry points.
Open chart in a new window
Inverse Head and Shoulder
was formed on 09.04 at 04:04:54 (UTC+0)
signal strength 1 of 5

According to the chart of M5, NZDCAD formed the Inverse Head and Shoulder pattern. The Head’s top is set at 0.7878 while the median line of the Neck is found
The M5 and M15 time frames may have more false entry points.
Open chart in a new window


