

Pola sebenarnya

Triple Bottom
was formed on 24.03 at 20:25:19 (UTC+0)
signal strength 1 of 5
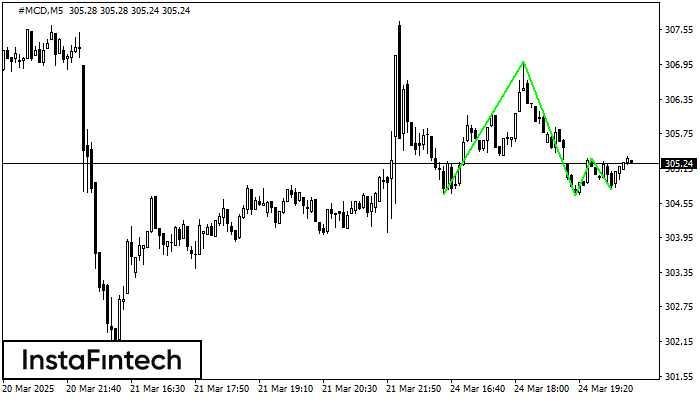
The Triple Bottom pattern has formed on the chart of the #MCD M5 trading instrument. The pattern signals a change in the trend from downwards to upwards in the case of breakdown of 307.00/305.33.
The M5 and M15 time frames may have more false entry points.
Lihat juga
- All
- All
- Bearish Rectangle
- Bearish Symmetrical Triangle
- Bearish Symmetrical Triangle
- Bullish Rectangle
- Double Top
- Double Top
- Triple Bottom
- Triple Bottom
- Triple Top
- Triple Top
- All
- All
- Buy
- Sale
- All
- 1
- 2
- 3
- 4
- 5
Kepala dan bahu
was formed on 31.03 at 08:40:22 (UTC+0)
signal strength 1 of 5

Menurut grafik M5, GBPAUD membentuk pola Kepala dan bahu. Puncak The Head ditetapkan di 2.0644 sementara garis median the Neck ditemukan di 2.0617/2.0613. Formasi pola Kepala dan bahu terbukti mensinyalkan
Rangka waktu M5 dan M15 mungkin memiliki lebih dari titik entri yang keliru.
Open chart in a new window
Teratas Triple
was formed on 31.03 at 08:30:26 (UTC+0)
signal strength 3 of 5

Pola Teratas Triple telah terbentuk pada grafik EURCAD M30. Fitur-fitur pola: perbatasan memiliki sudut yang naik; batas bawah pola memiliki koordinat 1.5476/1.5505 dengan batas atas 1.5517/1.5519; proyeksi lebar adalah
Open chart in a new window
Kepala dan bahu
was formed on 31.03 at 08:30:17 (UTC+0)
signal strength 3 of 5

Pola teknikal yang disebut Kepala dan bahu telah muncul pada grafik EURGBP M30. Terdapat banyak alasan untuk harga melewati Neckline 0.8358/0.8357 setelah Shoulder kanan terbentuk. Jadi, tren akan berubah dengan
Open chart in a new window


