

Pola sebenarnya

Double Bottom
was formed on 22.03 at 17:34:47 (UTC+0)
signal strength 1 of 5

The Double Bottom pattern has been formed on #Bitcoin M5. Characteristics: the support level 83931.70; the resistance level 84051.13; the width of the pattern 11943 points. If the resistance level is broken, a change in the trend can be predicted with the first target point lying at the distance of 10667 points.
The M5 and M15 time frames may have more false entry points.
Lihat juga
- All
- All
- Bearish Rectangle
- Bearish Symmetrical Triangle
- Bearish Symmetrical Triangle
- Bullish Rectangle
- Double Top
- Double Top
- Triple Bottom
- Triple Bottom
- Triple Top
- Triple Top
- All
- All
- Buy
- Sale
- All
- 1
- 2
- 3
- 4
- 5
Double Bottom
was formed on 24.03 at 19:15:45 (UTC+0)
signal strength 1 of 5
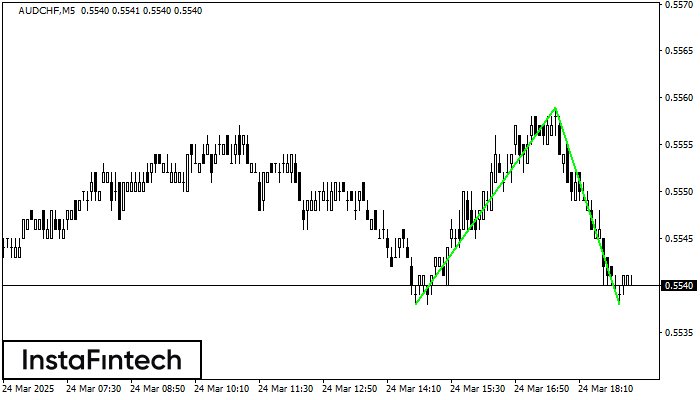
The Double Bottom pattern has been formed on AUDCHF M5. Characteristics: the support level 0.5538; the resistance level 0.5559; the width of the pattern 21 points. If the resistance level
The M5 and M15 time frames may have more false entry points.
Open chart in a new window
Bearish Rectangle
was formed on 24.03 at 19:11:46 (UTC+0)
signal strength 1 of 5
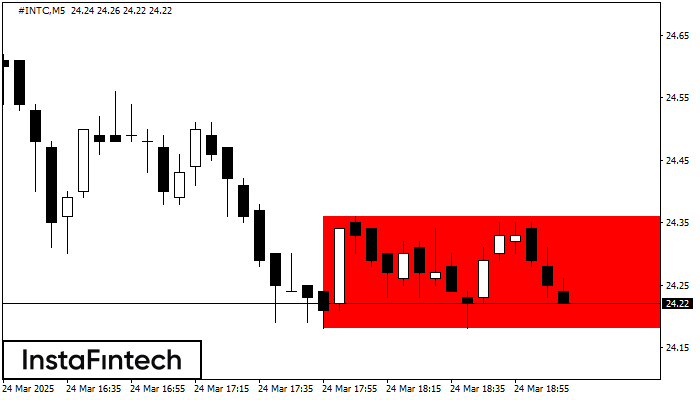
According to the chart of M5, #INTC formed the Bearish Rectangle. The pattern indicates a trend continuation. The upper border is 24.36, the lower border is 24.18. The signal means
The M5 and M15 time frames may have more false entry points.
Open chart in a new window
Double Bottom
was formed on 24.03 at 19:06:44 (UTC+0)
signal strength 1 of 5
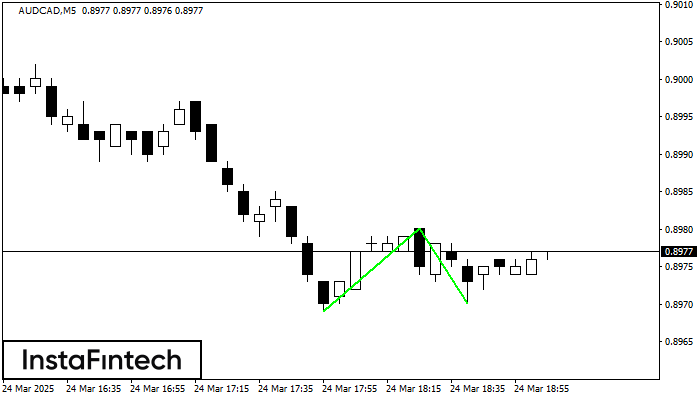
The Double Bottom pattern has been formed on AUDCAD M5; the upper boundary is 0.8980; the lower boundary is 0.8970. The width of the pattern is 11 points. In case
The M5 and M15 time frames may have more false entry points.
Open chart in a new window


