

Pola sebenarnya

Bullish Symmetrical Triangle
was formed on 21.03 at 22:40:31 (UTC+0)
signal strength 1 of 5

According to the chart of M5, AUDUSD formed the Bullish Symmetrical Triangle pattern. Description: This is the pattern of a trend continuation. 0.6279 and 0.6267 are the coordinates of the upper and lower borders respectively. The pattern width is measured on the chart at 12 pips. Outlook: If the upper border 0.6279 is broken, the price is likely to continue its move by 0.6288.
The M5 and M15 time frames may have more false entry points.
Lihat juga
- All
- All
- Bearish Rectangle
- Bearish Symmetrical Triangle
- Bearish Symmetrical Triangle
- Bullish Rectangle
- Double Top
- Double Top
- Triple Bottom
- Triple Bottom
- Triple Top
- Triple Top
- All
- All
- Buy
- Sale
- All
- 1
- 2
- 3
- 4
- 5
Teratas Ganda
was formed on 24.03 at 19:50:15 (UTC+0)
signal strength 1 of 5
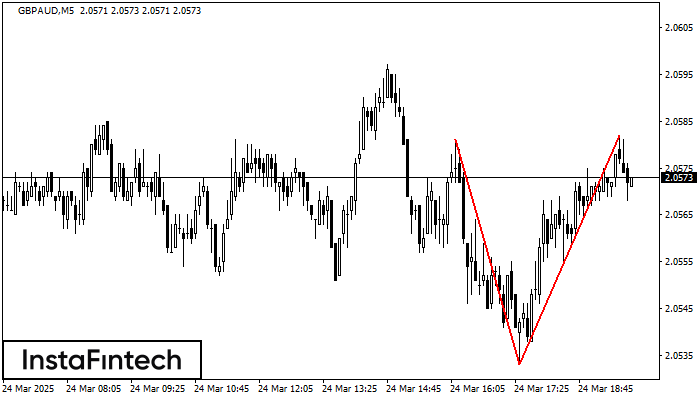
Pola reversal Teratas Ganda telah terbentuk pada GBPAUD M5. Karakteristik: batas atas 2.0581; batas bawah 2.0533; lebar pola 49 poin. Transaksi jual lebih baik dibuka di bawah batas bawah 2.0533
Rangka waktu M5 dan M15 mungkin memiliki lebih dari titik entri yang keliru.
Open chart in a new window
Bawah Ganda
was formed on 24.03 at 19:45:48 (UTC+0)
signal strength 1 of 5
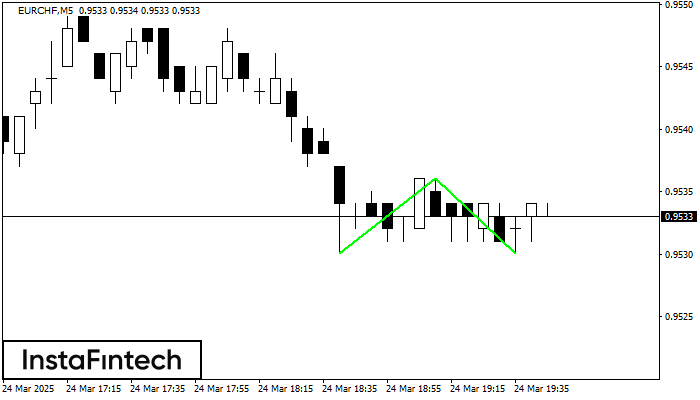
Pola Bawah Ganda telah terbentuk pada EURCHF M5. Formasi ini mensinyalkan reversal tren dari arah penurunan ke arah kenaikan. Sinyal menunjukkan bahwa transaksi beli harus dibuka setelah batas atas pola
Rangka waktu M5 dan M15 mungkin memiliki lebih dari titik entri yang keliru.
Open chart in a new window
Bendera Bearish
was formed on 24.03 at 19:35:18 (UTC+0)
signal strength 1 of 5

Pola Bendera Bearish telah terbentuk di grafik #INTC M5. Oleh karena itu, tren menurun kemungkinan akan berlanjut dalam waktu dekat. Segera setelah harga menembus ke bawah titik trendah di 24.13
Rangka waktu M5 dan M15 mungkin memiliki lebih dari titik entri yang keliru.
Open chart in a new window


