

Pola sebenarnya

Bearish Rectangle
was formed on 21.03 at 22:23:03 (UTC+0)
signal strength 2 of 5

According to the chart of M15, EURCHF formed the Bearish Rectangle which is a pattern of a trend continuation. The pattern is contained within the following borders: lower border 0.9539 – 0.9539 and upper border 0.9558 – 0.9558. In case the lower border is broken, the instrument is likely to follow the downward trend.
The M5 and M15 time frames may have more false entry points.
- All
- All
- Bearish Rectangle
- Bearish Symmetrical Triangle
- Bearish Symmetrical Triangle
- Bullish Rectangle
- Double Top
- Double Top
- Triple Bottom
- Triple Bottom
- Triple Top
- Triple Top
- All
- All
- Buy
- Sale
- All
- 1
- 2
- 3
- 4
- 5
Kepala dan bahu
was formed on 26.03 at 10:00:22 (UTC+0)
signal strength 1 of 5
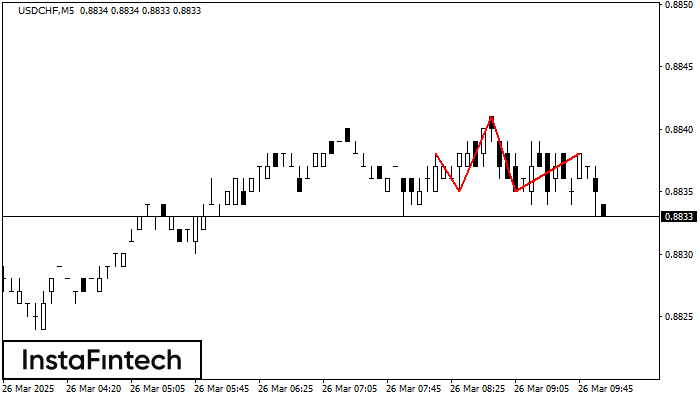
Menurut grafik M5, USDCHF membentuk pola Kepala dan bahu. Puncak The Head ditetapkan di 0.8841 sementara garis median the Neck ditemukan di 0.8835/0.8835. Formasi pola Kepala dan bahu terbukti mensinyalkan
Rangka waktu M5 dan M15 mungkin memiliki lebih dari titik entri yang keliru.
Open chart in a new window
Teratas Ganda
was formed on 26.03 at 09:45:05 (UTC+0)
signal strength 2 of 5
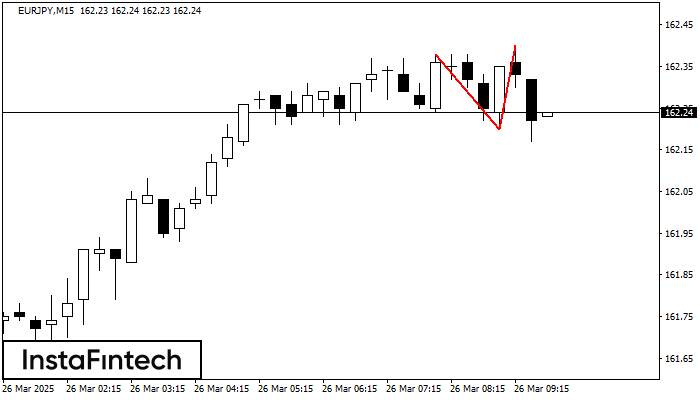
Pola reversal Teratas Ganda telah terbentuk pada EURJPY M15. Karakteristik: batas atas 162.38; batas bawah 162.20; lebar pola 20 poin. Transaksi jual lebih baik dibuka di bawah batas bawah 162.20
Rangka waktu M5 dan M15 mungkin memiliki lebih dari titik entri yang keliru.
Open chart in a new window
Segitiga Simetris Bullish
was formed on 26.03 at 09:45:02 (UTC+0)
signal strength 1 of 5
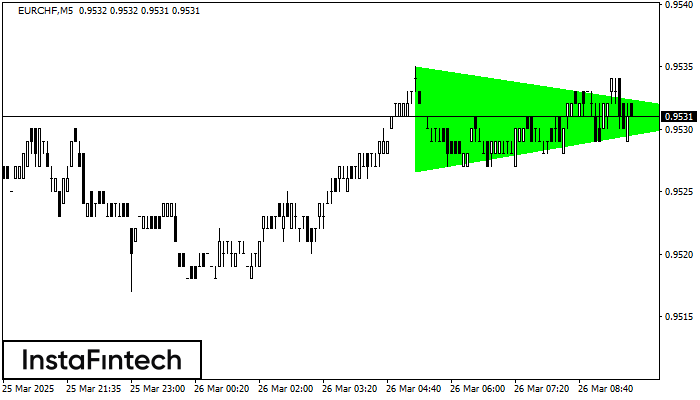
Menurut Grafik dari M5, EURCHF dibentuk pola Segitiga Simetris Bullish, yang menunjukkan tren akan berlanjut. Deksripsi. Batas atas dari pola menyentuh kordinat 0.9535/0.9531 dimana batas yang lebih rendah berada sepanjang
Rangka waktu M5 dan M15 mungkin memiliki lebih dari titik entri yang keliru.
Open chart in a new window


