Lihat juga


 01.04.2025 10:42 AM
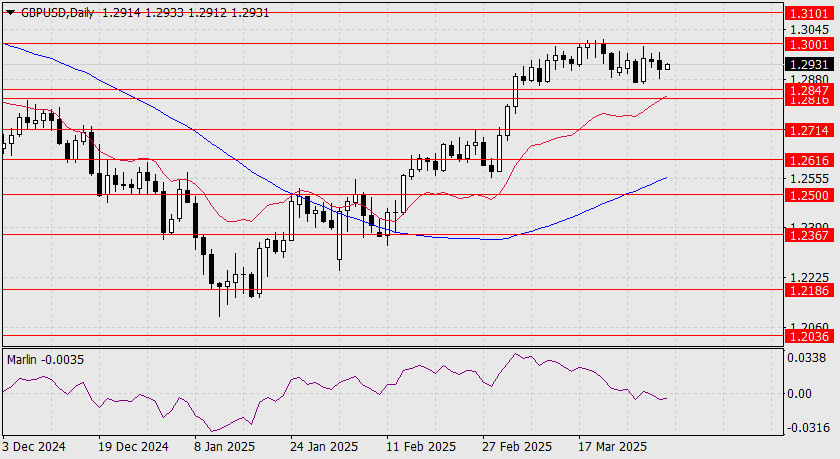
GBP/USD Only one day remains before President Trump imposes expanded tariffs on all "unfair" U.S. trade partners. The British pound remains uncertain about the UK's position on Washington's partnership list. The sideways trend within the 1.2847–1.3001 range continues. The current trend is clearly upward, and its technical outlook supports further growth.
We believe that Trump's tariffs against the United Kingdom will be relatively modest ("symbolic"), as since December last year, the stance of official U.S. media toward the UK has been neutral, and it's unlikely that the White House administration will dramatically alter that assessment in a moment of political fervor. A technical signal for continued growth would be a breakout above the upper boundary of the range at 1.3001. The next target would open at 1.3101, followed by 1.3184 – a strong level that has been relevant since 2019. The Marlin oscillator is currently pulling the price downward, but given the broader context, this could be interpreted as a factor restraining premature price growth.
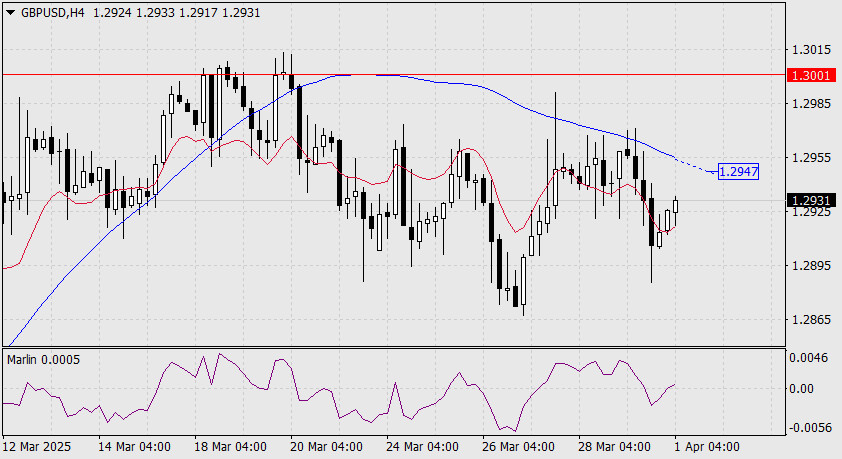
On the four-hour chart, the price did make a dip below the balance line, but then quickly returned above it, consistent with the ongoing sideways trend. A more convincing signal of further growth would be the price securing itself above the MACD line (1.2947).
You have already liked this post today
*Analisis pasar yang diposting disini dimaksudkan untuk meningkatkan pengetahuan Anda namun tidak untuk memberi instruksi trading.
Harga emas terus mendapatkan dukungan di tengah ketidakpastian yang menyelimuti masa depan perang tarif yang diprakarsai oleh Donald Trump. Harga emas telah naik hampir secara vertikal selama empat bulan. Pendorong
Dari apa yang Kita lihat di chart 4 jamnya indeks Nasdaq 100, nampak terlihat beberapa hal yang menarik, yaitu yang pertama, pergerakan harganya bergerak dibawah MA (100), kedua, munculnya pola
Pada awal sesi Amerika, emas trading sekitar 3,312 dengan bias bullish setelah menembus segitiga simetris. Emas kemungkinan akan terus naik dalam beberapa jam ke depan, mencapai level 7/8 Murray
Dengan kondisi Stochastic Oscillator yang tengah menuju ke level Oversold (20) pada chart 4 jam dari pasangan mata uang silang AUD/JPY, maka dalam waktu dekat ini AUD/JPY berpotensi untuk melemah
Pada chart 4 jamnya, pasangan mata uang komoditi USD/CAD nampak terlihat bergerak dibawah EMA (100) serta munculnya pola Bearish 123 serta posisi indikator Stochastic Oscillator yang sudah berada diatas level
Your IP address shows that you are currently located in the USA. If you are a resident of the United States, you are prohibited from using the services of InstaFintech Group including online trading, online transfers, deposit/withdrawal of funds, etc.
If you think you are seeing this message by mistake and your location is not the US, kindly proceed to the website. Otherwise, you must leave the website in order to comply with government restrictions.
Why does your IP address show your location as the USA?
Please confirm whether you are a US resident or not by clicking the relevant button below. If you choose the wrong option, being a US resident, you will not be able to open an account with InstaTrade anyway.
We are sorry for any inconvenience caused by this message.


