Actual patterns

Patterns are graphical models which are formed in the chart by the price. According to one of the technical analysis postulates, history (price movement) repeats itself. It means that the price movements are often similar in the same situations which makes it possible to predict the further development of the situation with a high probability.
Relevant patterns by InstaTrade is an easy-to-use service which allows you to be aware of latest changes in the market and react to clues from the market in time. In our service you will always find the latest and most relevant patterns on any pair and any timeframe.
Double Bottom
was formed on 31.03 at 02:40:33 (UTC+0)
signal strength 1 of 5
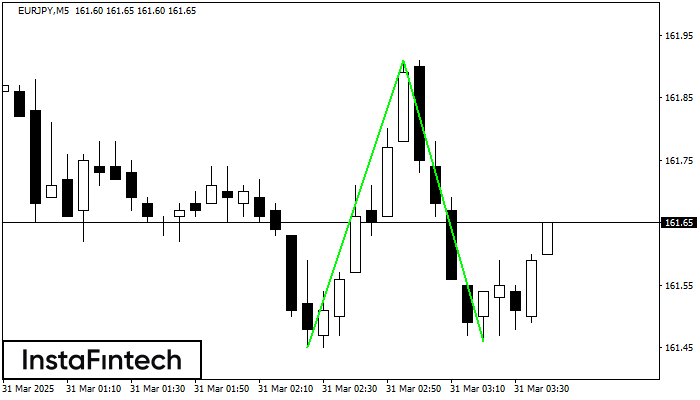
The Double Bottom pattern has been formed on EURJPY M5. This formation signals a reversal of the trend from downwards to upwards. The signal is that a buy trade should be opened after the upper boundary of the pattern 161.91 is broken. The further movements will rely on the width of the current pattern 46 points.
The M5 and M15 time frames may have more false entry points.
See Also
- All
- All
- Bearish Rectangle
- Bearish Symmetrical Triangle
- Bearish Symmetrical Triangle
- Bullish Rectangle
- Double Top
- Double Top
- Triple Bottom
- Triple Bottom
- Triple Top
- Triple Top
- All
- All
- Buy
- Sale
- All
- 1
- 2
- 3
- 4
- 5
Đáy đôi
was formed on 25.04 at 01:59:57 (UTC+0)
signal strength 3 of 5
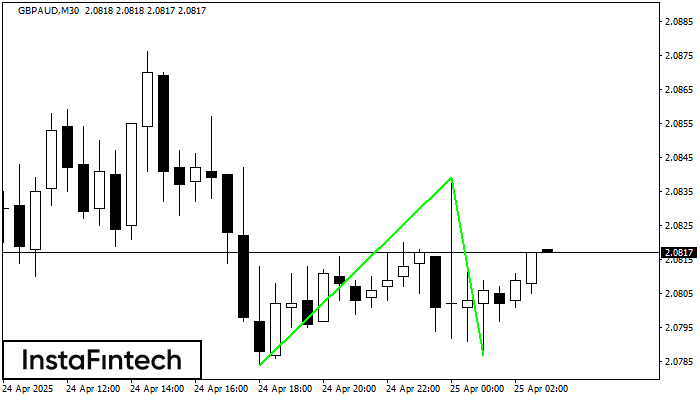
Mô hình Đáy đôi đã được hình thành trên GBPAUD M30. Đặc điểm: mức hỗ trợ 2.0784; mức kháng cự 2.0839; chiều rộng của mô hình 55 điểm
Open chart in a new window
Đỉnh đôi
was formed on 25.04 at 01:45:13 (UTC+0)
signal strength 2 of 5
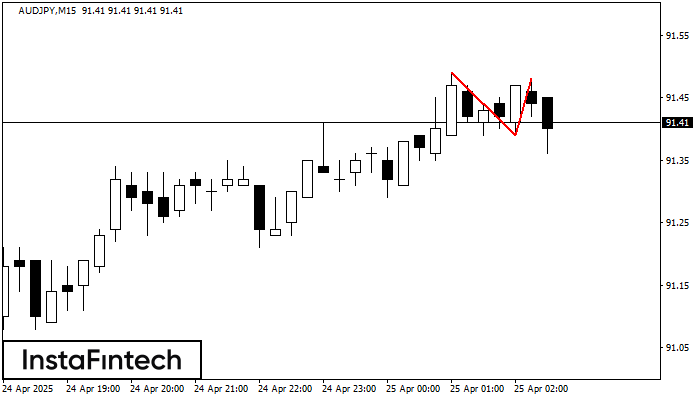
Trên biểu đồ AUDJPY M15, mô hình đảo chiều Đỉnh đôi đã được hình thành. Đặc điểm: ranh giới trên ở 91.48; ranh giới dưới ở 91.39; chiều rộng
Khung thời gian M5 và M15 có thể có nhiều điểm vào lệnh sai hơn.
Open chart in a new window
Đáy đôi
was formed on 25.04 at 00:30:11 (UTC+0)
signal strength 3 of 5
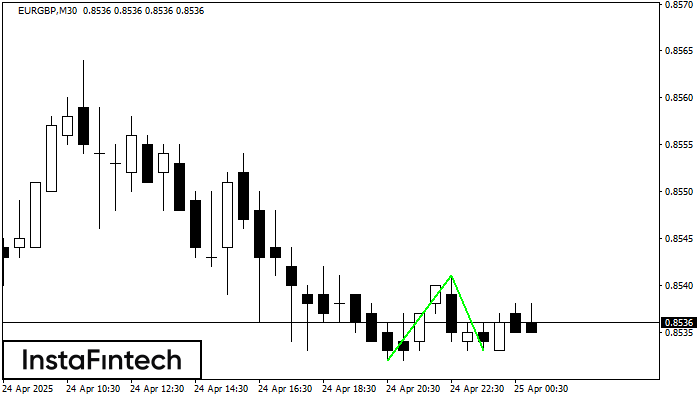
Mô hình Đáy đôi đã được hình thành trên EURGBP M30. Đặc điểm: mức hỗ trợ 0.8532; mức kháng cự 0.8541; chiều rộng của mô hình 9 điểm
Open chart in a new window