

Actual patterns

Patterns are graphical models which are formed in the chart by the price. According to one of the technical analysis postulates, history (price movement) repeats itself. It means that the price movements are often similar in the same situations which makes it possible to predict the further development of the situation with a high probability.
Relevant patterns by InstaTrade is an easy-to-use service which allows you to be aware of latest changes in the market and react to clues from the market in time. In our service you will always find the latest and most relevant patterns on any pair and any timeframe.
Head and Shoulders
was formed on 02.04 at 09:15:29 (UTC+0)
signal strength 1 of 5

The NZDJPY M5 formed the Head and Shoulders pattern with the following features: The Head’s top is at 85.95, the Neckline and the upward angle are at 85.69/85.68. The formation of this pattern can bring about changes in the current trend from bullish to bearish. In case the pattern triggers the expected changes, the price of NZDJPY will go towards 85.53.
The M5 and M15 time frames may have more false entry points.
- All
- All
- Bearish Rectangle
- Bearish Symmetrical Triangle
- Bearish Symmetrical Triangle
- Bullish Rectangle
- Double Top
- Double Top
- Triple Bottom
- Triple Bottom
- Triple Top
- Triple Top
- All
- All
- Buy
- Sale
- All
- 1
- 2
- 3
- 4
- 5
Bullish Symmetrical Triangle
сформирован 23.04 в 07:41:10 (UTC+0)
сила сигнала 1 из 5

According to the chart of M5, NZDJPY formed the Bullish Symmetrical Triangle pattern, which signals the trend will continue. Description. The upper border of the pattern touches the coordinates 85.07/84.81
The M5 and M15 time frames may have more false entry points.
Открыть график инструмента в новом окне
Double Top
сформирован 23.04 в 07:15:07 (UTC+0)
сила сигнала 2 из 5
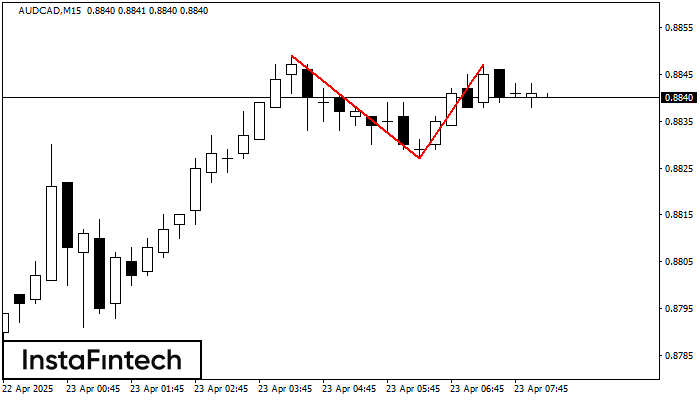
The Double Top pattern has been formed on AUDCAD M15. It signals that the trend has been changed from upwards to downwards. Probably, if the base of the pattern 0.8827
The M5 and M15 time frames may have more false entry points.
Открыть график инструмента в новом окне
Bullish pennant
сформирован 23.04 в 07:10:00 (UTC+0)
сила сигнала 1 из 5
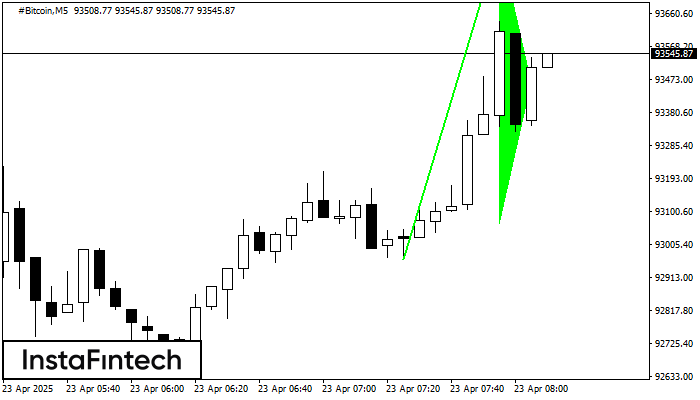
The Bullish pennant signal – Trading instrument #Bitcoin M5, continuation pattern. Forecast: it is possible to set up a buy position above the pattern’s high of 93868.36, with the prospect
The M5 and M15 time frames may have more false entry points.
Открыть график инструмента в новом окне


