

Actual patterns

Patterns are graphical models which are formed in the chart by the price. According to one of the technical analysis postulates, history (price movement) repeats itself. It means that the price movements are often similar in the same situations which makes it possible to predict the further development of the situation with a high probability.
Relevant patterns by InstaTrade is an easy-to-use service which allows you to be aware of latest changes in the market and react to clues from the market in time. In our service you will always find the latest and most relevant patterns on any pair and any timeframe.
Double Bottom
was formed on 14.04 at 10:00:17 (UTC+0)
signal strength 2 of 5

The Double Bottom pattern has been formed on USDJPY M15. Characteristics: the support level 142.26; the resistance level 143.29; the width of the pattern 103 points. If the resistance level is broken, a change in the trend can be predicted with the first target point lying at the distance of 104 points.
The M5 and M15 time frames may have more false entry points.
- All
- All
- Bearish Rectangle
- Bearish Symmetrical Triangle
- Bearish Symmetrical Triangle
- Bullish Rectangle
- Double Top
- Double Top
- Triple Bottom
- Triple Bottom
- Triple Top
- Triple Top
- All
- All
- Buy
- Sale
- All
- 1
- 2
- 3
- 4
- 5
รูปแบบกราฟหัวและหัวไหล่ (Head and Shoulders)
was formed on 25.04 at 11:16:23 (UTC+0)
signal strength 2 of 5

รูปแบบทางเทคนิค ทำให้เกิด รูปแบบกราฟหัวและหัวไหล่ (Head and Shoulders) ที่ปรากฎออกมาในชาร์ตของ USDCHF M15 มีเหตุผลที่หนักแน่นอยู่หลายประการที่แสดงให้เห็นว่า ราคาจะมุ่งหน้าผ่านตำแหน่งส่วนคอ 0.8293/0.8295 หลังจากตำแหน่งส่วนหัวไหล่ด้านขวาได้ถูกสร้างขึ้นมา ดังนั้นแนวโน้มจะมีการเปลี่ยนแปลงพร้อมกับราคาที่จะมุ่งหน้าไปยัง0.8273
ขอบเตระยะเวลาใน M5 และ M15 อาจจะมีตำแหน่งการเข้าใช้งานที่ผิดพลาดมากยิ่งขึ้น
Open chart in a new window
รูปแบบกราฟจุดสองยอดขาลง (Double Bottom)
was formed on 25.04 at 11:00:37 (UTC+0)
signal strength 1 of 5
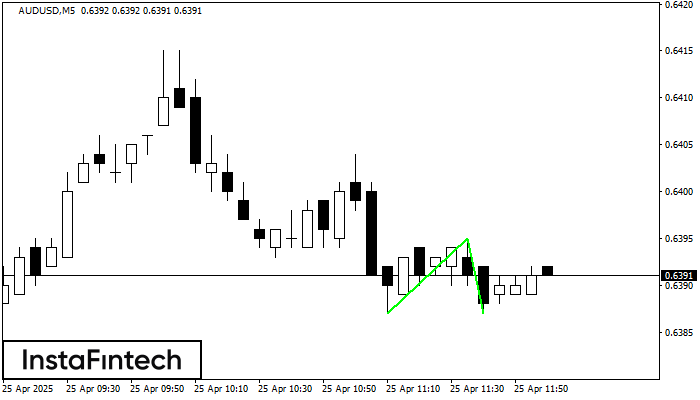
รูปแบบ รูปแบบกราฟจุดสองยอดขาลง (Double Bottom) ถูกสร้างขึ้นมาใน AUDUSD M5 การก่อตัวเช่นนี้แสดงถึงการย้อนตัวของแนวโน้มจากด้านล่าง ขึ้นมายังด้านบน สัญญาณแสดงให้เห็นถึง การเทรดแบบการซื้อที่ควรเปิด หลังจากที่มีการเคลื่อนตัวทะลุผ่านขอบเขตด้านบนของรูปแบบ 0.6395 การเคลื่อนไหวต่อจากนั้นจะอยู่ในความกว้างของรูปแบบปัจจุบัน
ขอบเตระยะเวลาใน M5 และ M15 อาจจะมีตำแหน่งการเข้าใช้งานที่ผิดพลาดมากยิ่งขึ้น
Open chart in a new window
รูปแบบกราฟจุดสองยอดขาลง (Double Bottom)
was formed on 25.04 at 10:50:23 (UTC+0)
signal strength 1 of 5
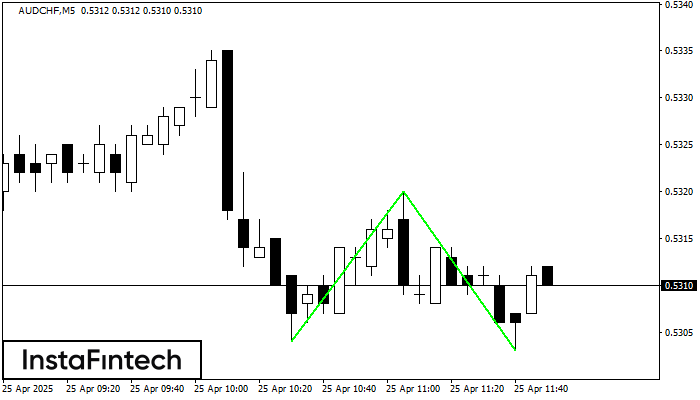
รูปแบบ รูปแบบกราฟจุดสองยอดขาลง (Double Bottom) ถูกสร้างขึ้นมาใน AUDCHF M5 คุณลักษณะ: ระดับของแนวรับ 0.5304; ระดับของแนวต้าน 0.5320; ความกว้างของรูปแบบ 16 จุด
ขอบเตระยะเวลาใน M5 และ M15 อาจจะมีตำแหน่งการเข้าใช้งานที่ผิดพลาดมากยิ่งขึ้น
Open chart in a new window


