

Actual patterns

Patterns are graphical models which are formed in the chart by the price. According to one of the technical analysis postulates, history (price movement) repeats itself. It means that the price movements are often similar in the same situations which makes it possible to predict the further development of the situation with a high probability.
Relevant patterns by InstaTrade is an easy-to-use service which allows you to be aware of latest changes in the market and react to clues from the market in time. In our service you will always find the latest and most relevant patterns on any pair and any timeframe.
Triple Top
was formed on 02.04 at 20:25:18 (UTC+0)
signal strength 1 of 5
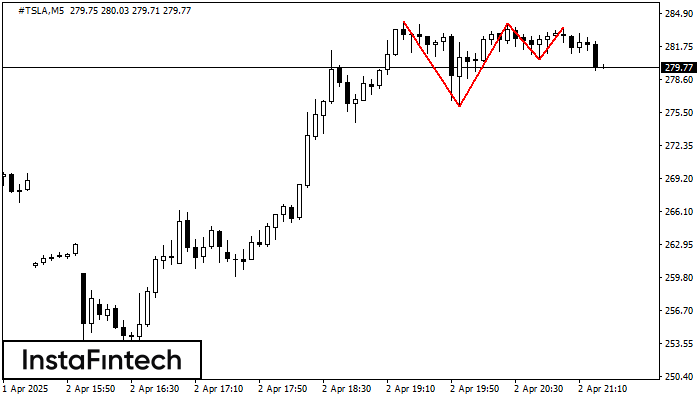
On the chart of the #TSLA M5 trading instrument, the Triple Top pattern that signals a trend change has formed. It is possible that after formation of the third peak, the price will try to break through the resistance level 276.07, where we advise to open a trading position for sale. Take profit is the projection of the pattern’s width, which is 805 points.
The M5 and M15 time frames may have more false entry points.
See Also
- All
- All
- Bearish Rectangle
- Bearish Symmetrical Triangle
- Bearish Symmetrical Triangle
- Bullish Rectangle
- Double Top
- Double Top
- Triple Bottom
- Triple Bottom
- Triple Top
- Triple Top
- All
- All
- Buy
- Sale
- All
- 1
- 2
- 3
- 4
- 5
Fundo triplo
was formed on 26.04 at 07:45:27 (UTC+0)
signal strength 2 of 5

O padrão Fundo triplo foi formado no gráfico do instrumento de negociação #Bitcoin M15. O padrão sinaliza uma mudança na tendência de baixa para alta no caso de quebra
Os intervalos M5 e M15 podem ter mais pontos de entrada falsos.
Open chart in a new window
Topo duplo
was formed on 25.04 at 22:10:22 (UTC+0)
signal strength 1 of 5

O padrão Topo duplo foi formado em AUDUSD M5. Isso sinaliza que a tendência foi alterada de cima para baixo. Provavelmente, se a base do padrão 0.6399 for quebrada
Os intervalos M5 e M15 podem ter mais pontos de entrada falsos.
Open chart in a new window
Topo duplo
was formed on 25.04 at 22:00:31 (UTC+0)
signal strength 2 of 5

No gráfico de GBPUSD M15 o padrão de reversão Topo duplo foi formado. Características: o limite superior 1.3332; o limite inferior 1.3315; a largura do padrão 17 pontos. O sinal
Os intervalos M5 e M15 podem ter mais pontos de entrada falsos.
Open chart in a new window


