

Actual patterns

Patterns are graphical models which are formed in the chart by the price. According to one of the technical analysis postulates, history (price movement) repeats itself. It means that the price movements are often similar in the same situations which makes it possible to predict the further development of the situation with a high probability.
Relevant patterns by InstaTrade is an easy-to-use service which allows you to be aware of latest changes in the market and react to clues from the market in time. In our service you will always find the latest and most relevant patterns on any pair and any timeframe.
Triple Bottom
was formed on 01.04 at 20:26:17 (UTC+0)
signal strength 1 of 5
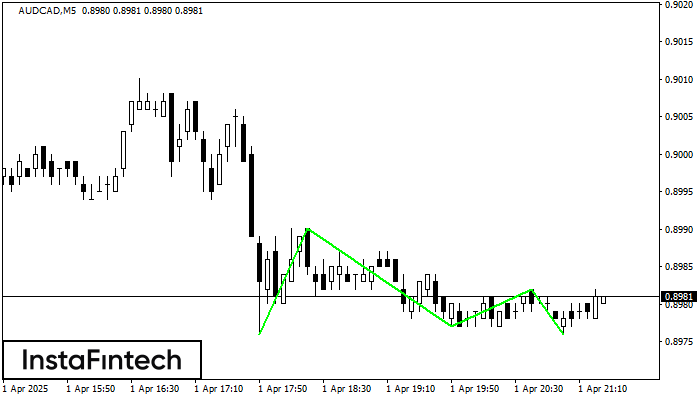
The Triple Bottom pattern has formed on the chart of the AUDCAD M5 trading instrument. The pattern signals a change in the trend from downwards to upwards in the case of breakdown of 0.8990/0.8982.
The M5 and M15 time frames may have more false entry points.
See Also
- All
- All
- Bearish Rectangle
- Bearish Symmetrical Triangle
- Bearish Symmetrical Triangle
- Bullish Rectangle
- Double Top
- Double Top
- Triple Bottom
- Triple Bottom
- Triple Top
- Triple Top
- All
- All
- Buy
- Sale
- All
- 1
- 2
- 3
- 4
- 5
Double Top
was formed on 25.04 at 03:15:29 (UTC+0)
signal strength 2 of 5
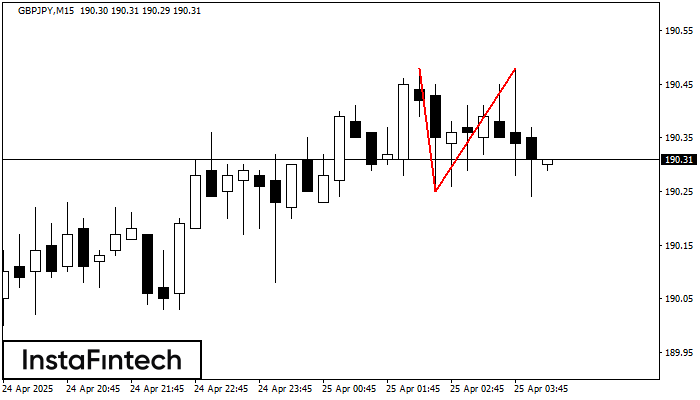
The Double Top reversal pattern has been formed on GBPJPY M15. Characteristics: the upper boundary 190.48; the lower boundary 190.25; the width of the pattern is 23 points. Sell trades
The M5 and M15 time frames may have more false entry points.
Open chart in a new window
Head and Shoulders
was formed on 25.04 at 03:15:22 (UTC+0)
signal strength 2 of 5
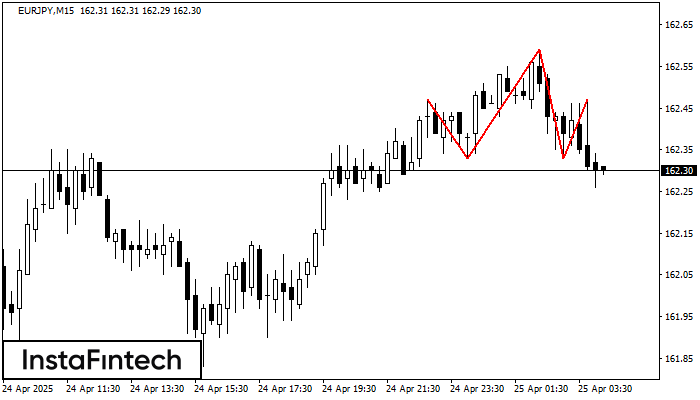
According to the chart of M15, EURJPY formed the Head and Shoulders pattern. The Head’s top is set at 162.59 while the median line of the Neck is found
The M5 and M15 time frames may have more false entry points.
Open chart in a new window
Bearish Symmetrical Triangle
was formed on 25.04 at 02:17:26 (UTC+0)
signal strength 2 of 5
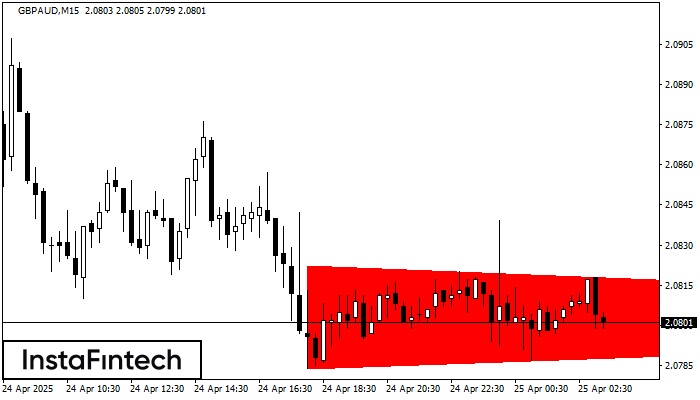
According to the chart of M15, GBPAUD formed the Bearish Symmetrical Triangle pattern. Description: The lower border is 2.0784/2.0802 and upper border is 2.0822/2.0802. The pattern width is measured
The M5 and M15 time frames may have more false entry points.
Open chart in a new window
Double Bottom
was formed on 25.04 at 01:59:57 (UTC+0)
signal strength 3 of 5
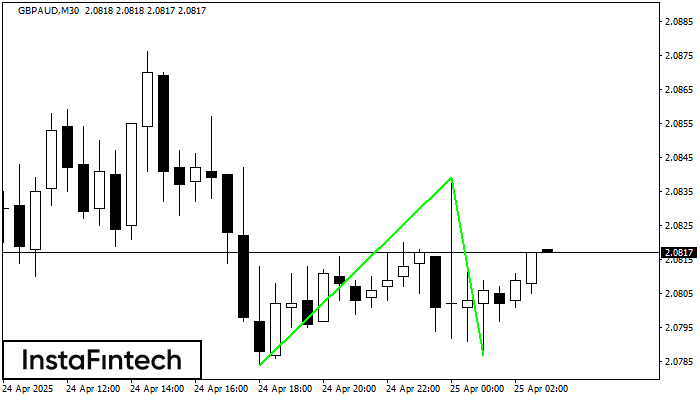
The Double Bottom pattern has been formed on GBPAUD M30. Characteristics: the support level 2.0784; the resistance level 2.0839; the width of the pattern 55 points. If the resistance level
Open chart in a new window
Double Top
was formed on 25.04 at 01:45:13 (UTC+0)
signal strength 2 of 5
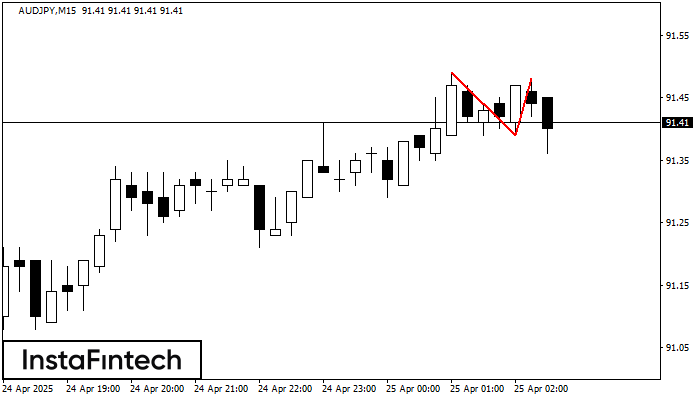
On the chart of AUDJPY M15 the Double Top reversal pattern has been formed. Characteristics: the upper boundary 91.48; the lower boundary 91.39; the width of the pattern 9 points
The M5 and M15 time frames may have more false entry points.
Open chart in a new window
Double Bottom
was formed on 25.04 at 00:30:11 (UTC+0)
signal strength 3 of 5
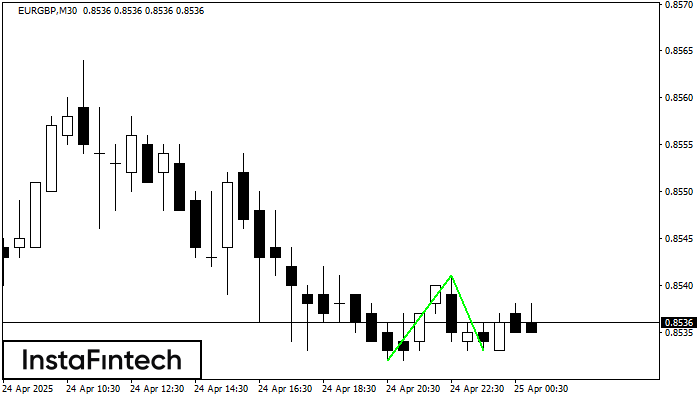
The Double Bottom pattern has been formed on EURGBP M30. Characteristics: the support level 0.8532; the resistance level 0.8541; the width of the pattern 9 points. If the resistance level
Open chart in a new window
Double Top
was formed on 25.04 at 00:30:06 (UTC+0)
signal strength 2 of 5
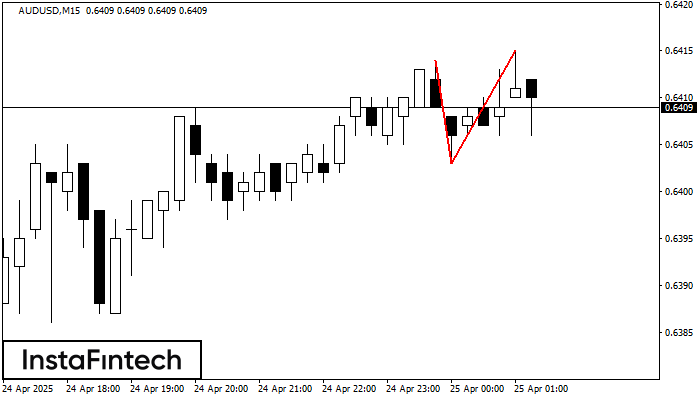
On the chart of AUDUSD M15 the Double Top reversal pattern has been formed. Characteristics: the upper boundary 0.6415; the lower boundary 0.6403; the width of the pattern 12 points
The M5 and M15 time frames may have more false entry points.
Open chart in a new window
Double Top
was formed on 24.04 at 23:31:04 (UTC+0)
signal strength 3 of 5
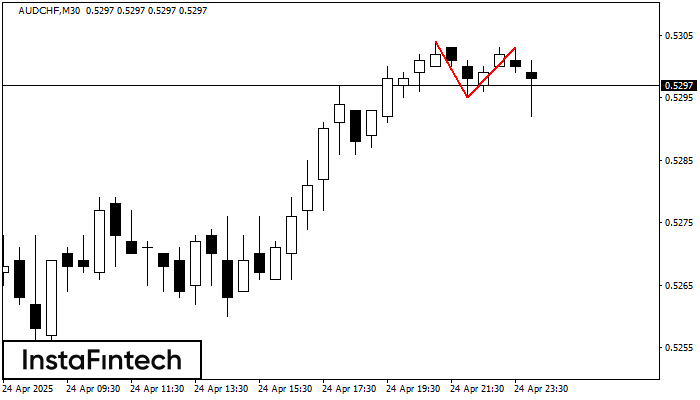
The Double Top pattern has been formed on AUDCHF M30. It signals that the trend has been changed from upwards to downwards. Probably, if the base of the pattern 0.5295
Open chart in a new window
Triple Top
was formed on 24.04 at 23:25:14 (UTC+0)
signal strength 1 of 5
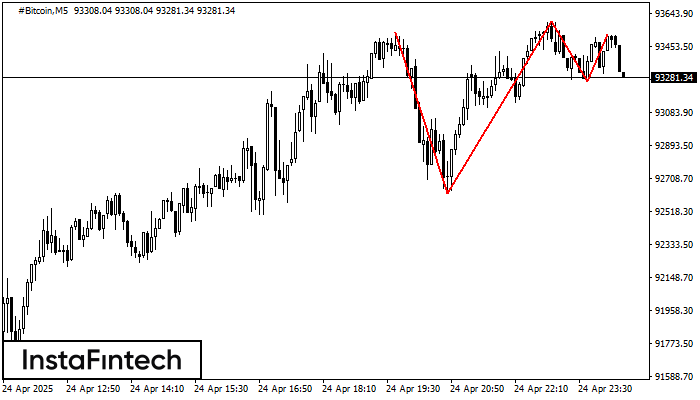
On the chart of the #Bitcoin M5 trading instrument, the Triple Top pattern that signals a trend change has formed. It is possible that after formation of the third peak
The M5 and M15 time frames may have more false entry points.
Open chart in a new window


