See also


 03.04.2025 05:07 AM
Oil (CL)
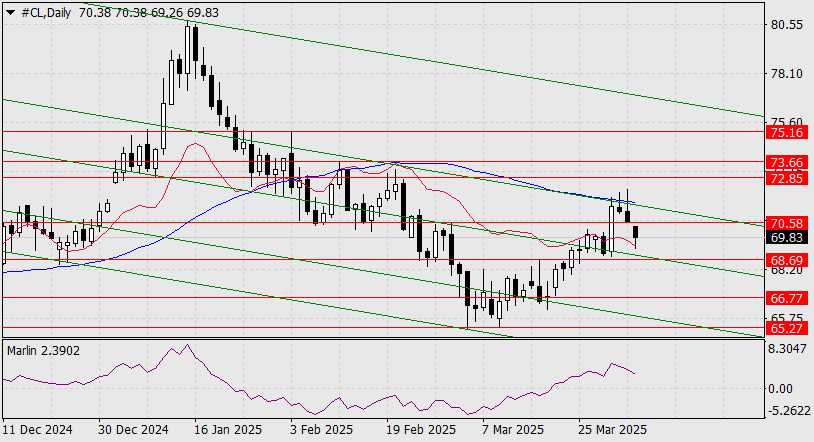
Market participants anticipate a disruption in global trade following President Trump's sweeping tariffs imposed yesterday on all U.S. trading partners. On the daily chart, the upper wick of the latest candle pierced the resistance level and the MACD line.
This morning, the price tested the balance line indicator but is now nearly settled below the 70.58 level, increasing the chances of reaching the next target at 68.69. At that point, the signal line of the Marlin oscillator may reach the boundary of the downtrend territory, intensifying pressure — a simultaneous price breakdown of the level and the oscillator crossing below the zero line would amplify the bearish momentum. The target level of 66.77 may be reached soon, possibly influenced by tomorrow's U.S. employment data. Caution is advised around that time.
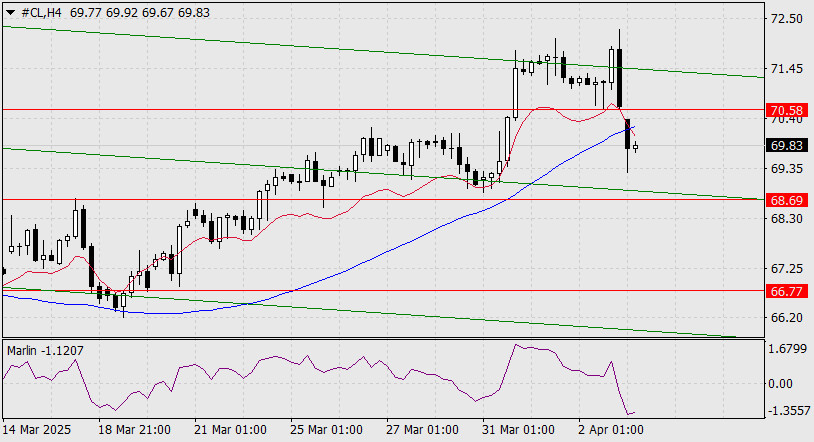
On the H4 chart, the price has settled below the MACD line. It may pause here briefly while the Marlin oscillator cools slightly. After that, a renewed push toward 68.69 is expected, most likely with success.
You have already liked this post today
*The market analysis posted here is meant to increase your awareness, but not to give instructions to make a trade.
Useful links: My other articles are available in this section InstaForex course for beginners Popular Analytics Open trading account Important: The begginers in forex trading need to be very careful
If we look at the 4-hour chart of the GBP/CHF cross currency pair, there are several interesting facts. First, the appearance of a Triangle pattern followed by the movement
With the price movement of the AUD/CAD cross currency pair moving above the WMA (21) which has an upward slopes and the appearance of Convergence between the price movement
The eagle indicator has reached overbought levels. However, the metal could still reach the high around 8/8 Murray, which represents a strong barrier for gold. Below this area, we could
From what is seen on the 4-hour chart, the EUR/GBP cross currency pair appears to be moving above the EMA (100), which indicates that Buyers dominate the currency pair
With the appearance of Convergence between the price movement of the main currency pair USD/JPY with the Stochastic Oscillator indicator and the position of the EMA (100) which is above
Useful links: My other articles are available in this section InstaForex course for beginners Popular Analytics Open trading account Important: The begginers in forex trading need to be very careful
 Our new app for your convenient and fast verification
Forex Chart
Web-version

Your IP address shows that you are currently located in the USA. If you are a resident of the United States, you are prohibited from using the services of InstaFintech Group including online trading, online transfers, deposit/withdrawal of funds, etc.
If you think you are seeing this message by mistake and your location is not the US, kindly proceed to the website. Otherwise, you must leave the website in order to comply with government restrictions.
Why does your IP address show your location as the USA?
Please confirm whether you are a US resident or not by clicking the relevant button below. If you choose the wrong option, being a US resident, you will not be able to open an account with InstaTrade anyway.
We are sorry for any inconvenience caused by this message.


