See also


 10.12.2024 01:11 PM
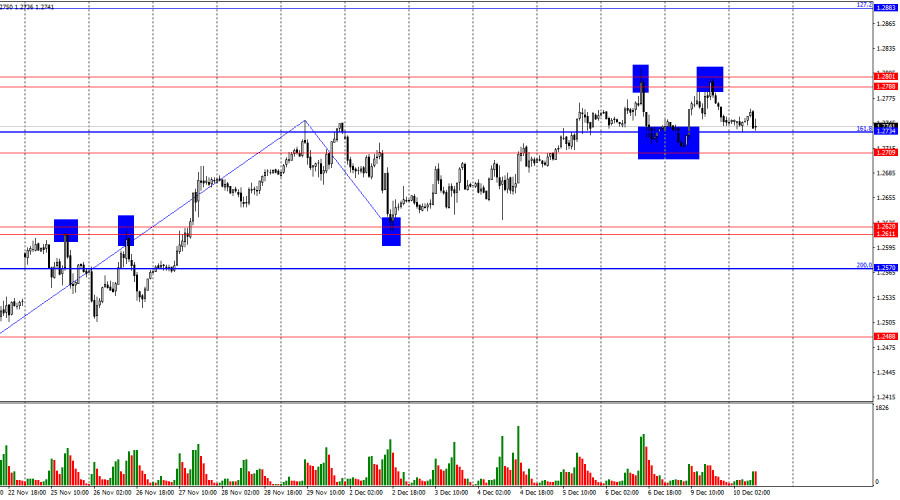
On the hourly chart, GBP/USD on Monday returned to the resistance zone of 1.2788–1.2801, rebounded from it, reversed in favor of the U.S. dollar, and dropped back to the support zone of 1.2709–1.2734. Consolidating below this zone could pave the way for further declines toward 1.2611–1.2620 and even signal the end of the "bullish" trend. A rebound from the 1.2709–1.2734 zone would sustain the bullish trend and allow for another return to 1.2788–1.2801.
The wave structure raises no questions. The new upward wave broke the previous peak, while the last completed downward wave did not breach the prior low. This indicates the potential end of the "bearish" trend and the beginning of a "bullish" one. However, I believe the bullish trend may remain weak. Last week, bulls attacked confidently, paying little attention to the information background.
On Monday, there were no significant news releases for the pound or the dollar, and the rest of the week looks quiet as well. The U.S. inflation data for December, set to be released tomorrow, is currently the market's main focus. High inflation (relative to forecasts) could not only drive intraday dollar gains but also spark a new "bearish" trend. Low inflation would suggest that the Federal Reserve may ease monetary policy in December, potentially leading to a decline in the dollar.
However, even in this scenario, I do not expect the dollar to weaken significantly. Currently, traders have more compelling reasons to buy the dollar than to sell it. The U.S. economy is thriving, and Donald Trump's presidency is perceived by many as the beginning of a new era of economic prosperity. Moreover, inflation under Trump could rise, prompting a more hawkish Fed monetary policy. Higher rates would also support the dollar. For now, the pound lacks comparable drivers.
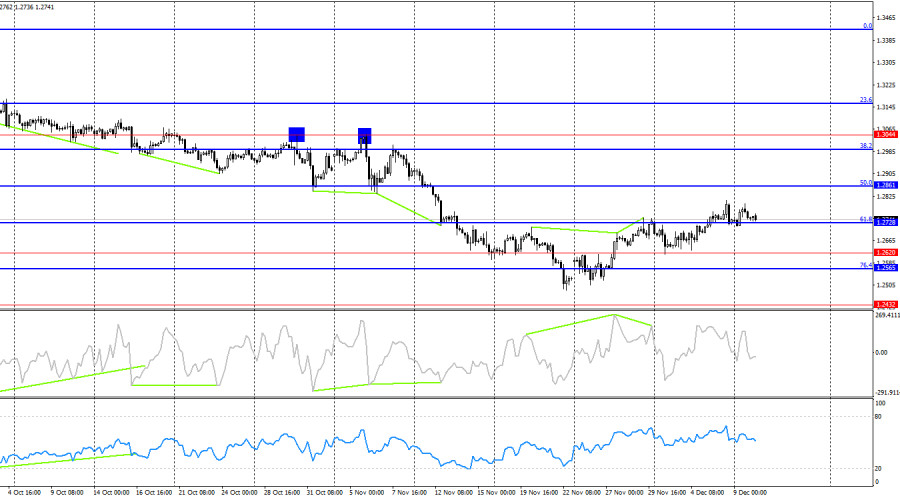
On the 4-hour chart, the pair returned to the 61.8% retracement level at 1.2728 and consolidated above it. This suggests that growth could continue toward the next retracement level at 50.0%, or 1.2861. Conversely, consolidating below 1.2728 would signal the resumption of the "bearish" trend, which is clearly visible on the 4-hour chart.
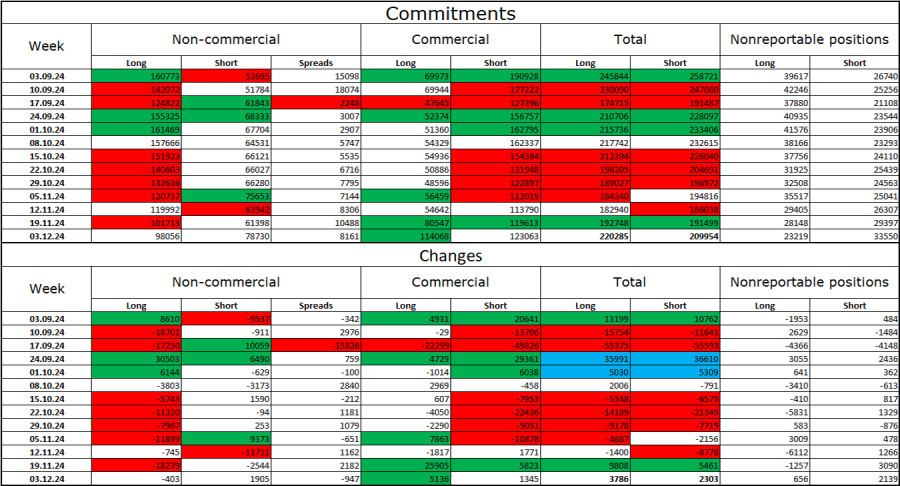
Sentiment among "Non-commercial" traders became less bullish over the last reporting week. Long positions held by speculators decreased by 403, while short positions increased by 1,905. Bulls still have the upper hand, but their advantage has been dwindling in recent months. The gap between long and short positions is now just 19,000 (98,000 vs. 79,000).
In my view, the pound remains vulnerable to further declines, and COT reports suggest that bearish positions have been strengthening almost every week. Over the last three months, long contracts have dropped from 160,000 to 98,000, while short contracts have risen from 52,000 to 79,000. I believe professional players will continue to reduce longs or increase shorts over time, as all potential factors supporting pound purchases have already been priced in. Graphical analysis also points to further declines in the pound.
On Tuesday, the economic calendar contains no notable entries, meaning the information background will not impact trader sentiment today.
Fibonacci Levels:Fibonacci levels are drawn from 1.3000–1.3432 on the hourly chart and from 1.2299–1.3432 on the 4-hour chart.
You have already liked this post today
*The market analysis posted here is meant to increase your awareness, but not to give instructions to make a trade.
Useful links: My other articles are available in this section InstaForex course for beginners Popular Analytics Open trading account Important: The begginers in forex trading need to be very careful
If we look at the 4-hour chart of the GBP/CHF cross currency pair, there are several interesting facts. First, the appearance of a Triangle pattern followed by the movement
With the price movement of the AUD/CAD cross currency pair moving above the WMA (21) which has an upward slopes and the appearance of Convergence between the price movement
The eagle indicator has reached overbought levels. However, the metal could still reach the high around 8/8 Murray, which represents a strong barrier for gold. Below this area, we could
From what is seen on the 4-hour chart, the EUR/GBP cross currency pair appears to be moving above the EMA (100), which indicates that Buyers dominate the currency pair
With the appearance of Convergence between the price movement of the main currency pair USD/JPY with the Stochastic Oscillator indicator and the position of the EMA (100) which is above
Useful links: My other articles are available in this section InstaForex course for beginners Popular Analytics Open trading account Important: The begginers in forex trading need to be very careful

Your IP address shows that you are currently located in the USA. If you are a resident of the United States, you are prohibited from using the services of InstaFintech Group including online trading, online transfers, deposit/withdrawal of funds, etc.
If you think you are seeing this message by mistake and your location is not the US, kindly proceed to the website. Otherwise, you must leave the website in order to comply with government restrictions.
Why does your IP address show your location as the USA?
Please confirm whether you are a US resident or not by clicking the relevant button below. If you choose the wrong option, being a US resident, you will not be able to open an account with InstaTrade anyway.
We are sorry for any inconvenience caused by this message.


