

Actual patterns

Patterns are graphical models which are formed in the chart by the price. According to one of the technical analysis postulates, history (price movement) repeats itself. It means that the price movements are often similar in the same situations which makes it possible to predict the further development of the situation with a high probability.
Relevant patterns by InstaTrade is an easy-to-use service which allows you to be aware of latest changes in the market and react to clues from the market in time. In our service you will always find the latest and most relevant patterns on any pair and any timeframe.
Triple Top
was formed on 31.03 at 13:10:27 (UTC+0)
signal strength 1 of 5
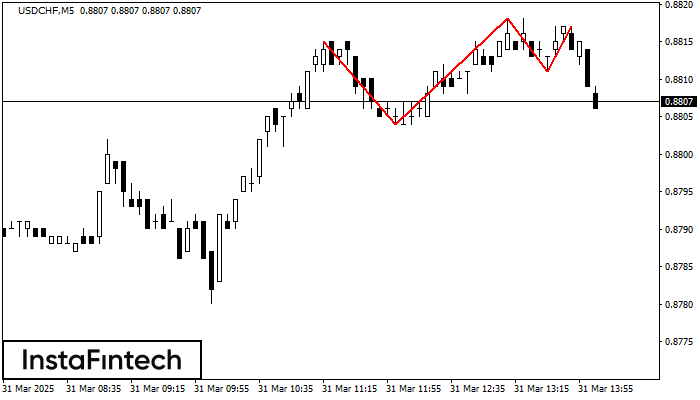
On the chart of the USDCHF M5 trading instrument, the Triple Top pattern that signals a trend change has formed. It is possible that after formation of the third peak, the price will try to break through the resistance level 0.8804, where we advise to open a trading position for sale. Take profit is the projection of the pattern’s width, which is 11 points.
The M5 and M15 time frames may have more false entry points.
See Also
- All
- All
- Bearish Rectangle
- Bearish Symmetrical Triangle
- Bearish Symmetrical Triangle
- Bullish Rectangle
- Double Top
- Double Top
- Triple Bottom
- Triple Bottom
- Triple Top
- Triple Top
- All
- All
- Buy
- Sale
- All
- 1
- 2
- 3
- 4
- 5
Double Bottom
was formed on 22.04 at 15:30:30 (UTC+0)
signal strength 4 of 5
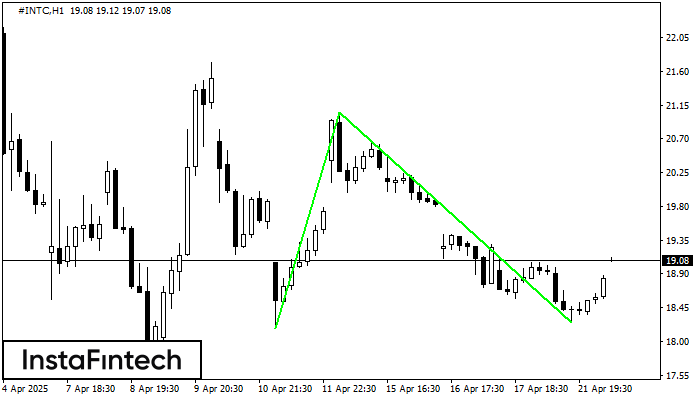
Corak Double Bottom telah dibentuk pada #INTC H1; sempadan atas adalah 21.05; sempadan bawah adalah 18.25. Lebar corak adalah 287 mata. Sekiranya penembusan sempadan atas 21.05, perubahan aliran boleh diramalkan
Open chart in a new window
Double Bottom
was formed on 22.04 at 14:06:13 (UTC+0)
signal strength 1 of 5

Corak Double Bottom telah dibentuk pada NZDCHF M5; sempadan atas adalah 0.4874; sempadan bawah adalah 0.4857. Lebar corak adalah 17 mata. Sekiranya penembusan sempadan atas 0.4874, perubahan aliran boleh diramalkan
Carta masa M5 dan M15 mungkin mempunyai lebih banyak titik kemasukan palsu.
Open chart in a new window
Double Bottom
was formed on 22.04 at 13:40:19 (UTC+0)
signal strength 1 of 5

Corak Double Bottom telah dibentuk pada GBPJPY M5. Ciri-ciri: tahap sokongan 187.44; tahap rintangan 187.65; lebar corak 21 mata. Sekiranya tahap rintangan ditembusi, perubahan aliran boleh diramalkan dengan titik sasaran
Carta masa M5 dan M15 mungkin mempunyai lebih banyak titik kemasukan palsu.
Open chart in a new window


