

Actual patterns

Patterns are graphical models which are formed in the chart by the price. According to one of the technical analysis postulates, history (price movement) repeats itself. It means that the price movements are often similar in the same situations which makes it possible to predict the further development of the situation with a high probability.
Relevant patterns by InstaTrade is an easy-to-use service which allows you to be aware of latest changes in the market and react to clues from the market in time. In our service you will always find the latest and most relevant patterns on any pair and any timeframe.
Double Bottom
was formed on 31.03 at 05:35:10 (UTC+0)
signal strength 1 of 5

The Double Bottom pattern has been formed on USDJPY M5. Characteristics: the support level 148.74; the resistance level 148.96; the width of the pattern 22 points. If the resistance level is broken, a change in the trend can be predicted with the first target point lying at the distance of 21 points.
The M5 and M15 time frames may have more false entry points.
See Also
- All
- All
- Bearish Rectangle
- Bearish Symmetrical Triangle
- Bearish Symmetrical Triangle
- Bullish Rectangle
- Double Top
- Double Top
- Triple Bottom
- Triple Bottom
- Triple Top
- Triple Top
- All
- All
- Buy
- Sale
- All
- 1
- 2
- 3
- 4
- 5
Triple Techo
was formed on 24.04 at 16:00:15 (UTC+0)
signal strength 3 of 5
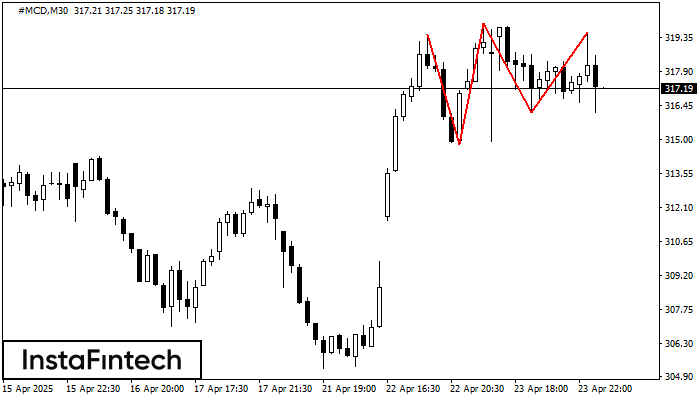
El patrón Triple Techo ha sido formado en el gráfico de #MCD M30. Características del patrón: los límites tienen un ángulo ascendente, la línea inferior del patrón tiene coordenadas 314.80/316.18
Open chart in a new window
Triple Piso
was formed on 24.04 at 08:30:33 (UTC+0)
signal strength 3 of 5
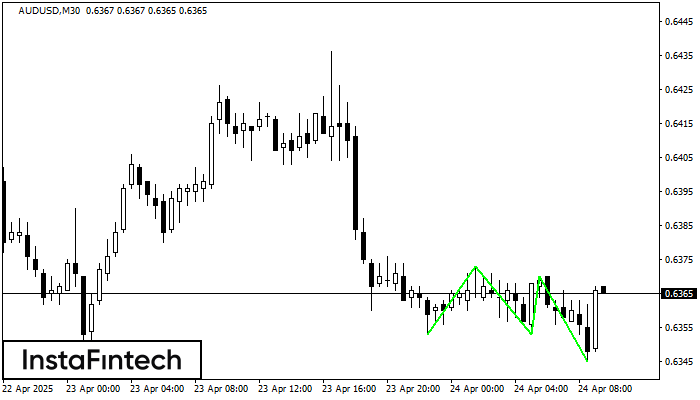
El patrón Triple Piso ha sido formado en el gráfico de AUDUSD M30. Características del patrón: línea inferior del patrón tiene coordenadas 0.6373 con el límite superior 0.6373/0.6370, la proyección
Open chart in a new window
Triple Piso
was formed on 24.04 at 05:00:18 (UTC+0)
signal strength 3 of 5
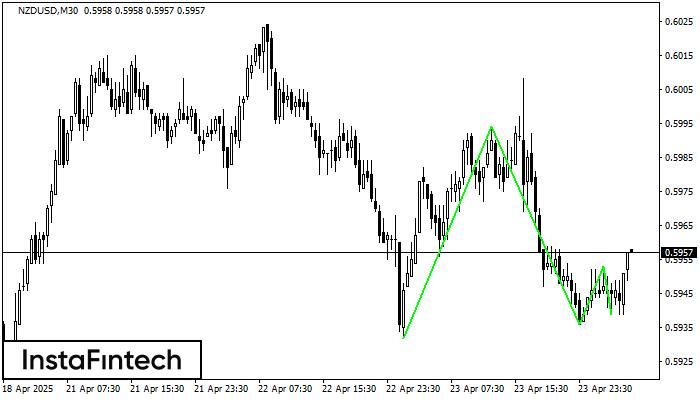
El patrón Triple Piso ha sido formado en el gráfico de NZDUSD M30. Características del patrón: línea inferior del patrón tiene coordenadas 0.5994 con el límite superior 0.5994/0.5953, la proyección
Open chart in a new window


