

Actual patterns

Patterns are graphical models which are formed in the chart by the price. According to one of the technical analysis postulates, history (price movement) repeats itself. It means that the price movements are often similar in the same situations which makes it possible to predict the further development of the situation with a high probability.
Relevant patterns by InstaTrade is an easy-to-use service which allows you to be aware of latest changes in the market and react to clues from the market in time. In our service you will always find the latest and most relevant patterns on any pair and any timeframe.
Double Bottom
was formed on 30.03 at 15:20:10 (UTC+0)
signal strength 1 of 5
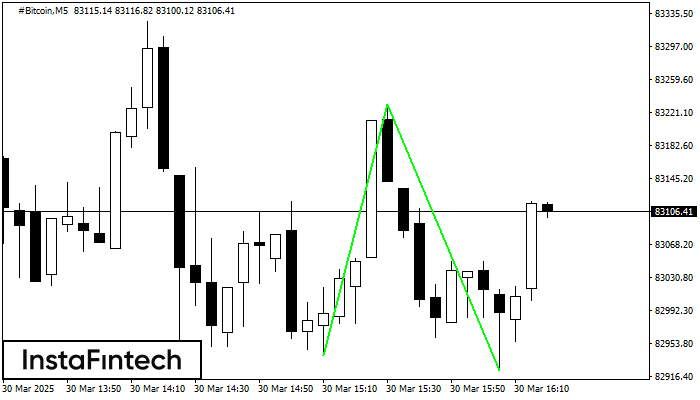
The Double Bottom pattern has been formed on #Bitcoin M5. This formation signals a reversal of the trend from downwards to upwards. The signal is that a buy trade should be opened after the upper boundary of the pattern 83229.64 is broken. The further movements will rely on the width of the current pattern 28940 points.
The M5 and M15 time frames may have more false entry points.
See Also
- All
- All
- Bearish Rectangle
- Bearish Symmetrical Triangle
- Bearish Symmetrical Triangle
- Bullish Rectangle
- Double Top
- Double Top
- Triple Bottom
- Triple Bottom
- Triple Top
- Triple Top
- All
- All
- Buy
- Sale
- All
- 1
- 2
- 3
- 4
- 5
Retângulo de baixa
was formed on 14.04 at 05:44:19 (UTC+0)
signal strength 1 of 5
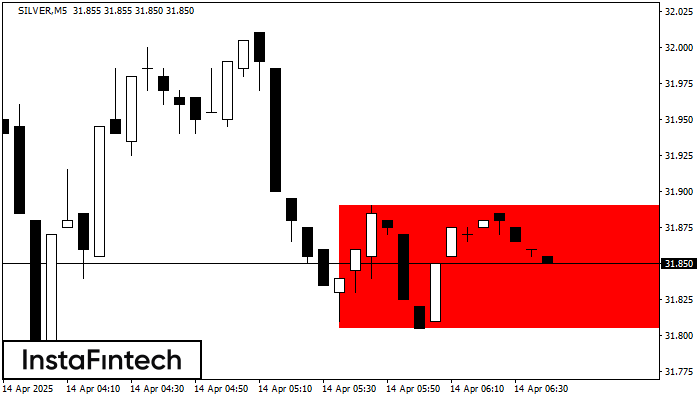
De acordo com o gráfico de M5, SILVER formou Retângulo de baixa que é um padrão de uma continuação de tendência. O padrão está dentro dos seguintes limites: limite inferior
Os intervalos M5 e M15 podem ter mais pontos de entrada falsos.
Open chart in a new window
Cabeça & Ombros
was formed on 14.04 at 05:15:40 (UTC+0)
signal strength 1 of 5

De acordo com o gráfico de M5, EURCAD formou o padrão Cabeça & Ombros. O topo da Cabeça está definido em 1.5811 enquanto a linha mediana do Pescoço é encontrada
Os intervalos M5 e M15 podem ter mais pontos de entrada falsos.
Open chart in a new window
Fundo duplo
was formed on 14.04 at 04:45:49 (UTC+0)
signal strength 1 of 5

O padrão Fundo duplo foi formado em NZDCAD M5. Esta formação sinaliza uma reversão da tendência de baixo para cima. O sinal é que uma negociação de compra deve
Os intervalos M5 e M15 podem ter mais pontos de entrada falsos.
Open chart in a new window


