

অ্যাকচুয়াল প্যাটার্নস

প্যাটার্ন হলো গ্রাফিক্যাল মডেল, যা মূল্য ওঠানামার ভিত্তিতে চার্টে তৈরি হয়। টেকনিক্যাল বিশ্লেষণের নীতি অনুযায়ী, ইতিহাসের (প্রাইস মুভমেন্ট) পুনরাবৃত্তি ঘটে। অর্থাৎ, পরিস্থিতি যদি একই রকম থাকে তাহলে প্রাইস মুভমেন্টও প্রায় একই রকম হয়। এর ফলে মূল্যের ওঠানামা কেমন হবে তা আগেই থেকেই অনুমান করা যায়।
ইন্সটাফরেক্স এর প্রাসঙ্গিক প্যাটার্নসমূহ সহজেই ব্যবহার করা যায়, যার মাধ্যমে মার্কেটের সর্বশেষ পরিস্থিতি জানা যায় এবং তার উপর ভিত্তি করে সিদ্ধান্ত নেওয়া যায়। আমাদের সেবাগুলো থেকে আপনি যেকোনো পেয়ার এবং টাইমফ্রেমের জন্য সর্বশেষ এবং সবচেয়ে প্রাসঙ্গিক প্যাটার্নগুলো খুঁজে পাবেন।
Bullish Rectangle
was formed on 01.04 at 07:00:39 (UTC+0)
signal strength 4 of 5
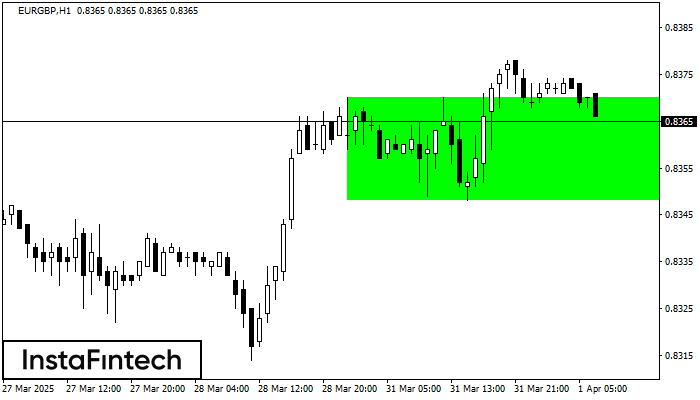
According to the chart of H1, EURGBP formed the Bullish Rectangle. The pattern indicates a trend continuation. The upper border is 0.8370, the lower border is 0.8348. The signal means that a long position should be opened above the upper border 0.8370 of the Bullish Rectangle.
- All
- All
- Bearish Rectangle
- Bearish Symmetrical Triangle
- Bearish Symmetrical Triangle
- Bullish Rectangle
- Double Top
- Double Top
- Triple Bottom
- Triple Bottom
- Triple Top
- Triple Top
- All
- All
- Buy
- Sale
- All
- 1
- 2
- 3
- 4
- 5
Double Top
сформирован 23.04 в 16:59:54 (UTC+0)
сила сигнала 1 из 5
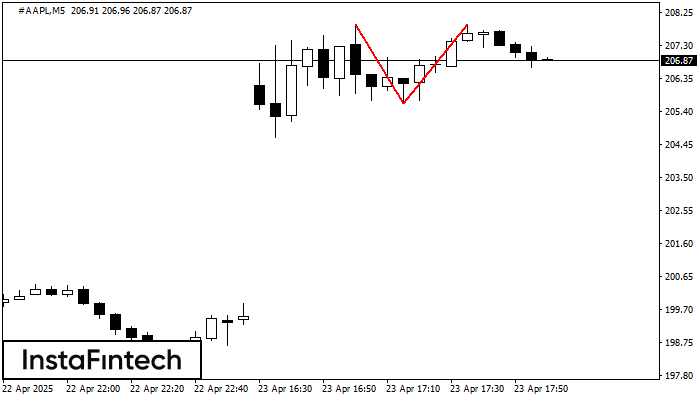
On the chart of #AAPL M5 the Double Top reversal pattern has been formed. Characteristics: the upper boundary 207.91; the lower boundary 205.63; the width of the pattern 228 points
The M5 and M15 time frames may have more false entry points.
Открыть график инструмента в новом окне
Double Top
сформирован 23.04 в 16:54:48 (UTC+0)
сила сигнала 1 из 5
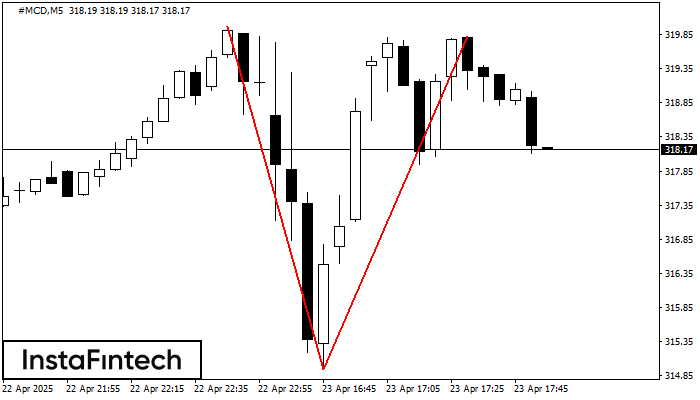
The Double Top reversal pattern has been formed on #MCD M5. Characteristics: the upper boundary 319.97; the lower boundary 314.94; the width of the pattern is 488 points. Sell trades
The M5 and M15 time frames may have more false entry points.
Открыть график инструмента в новом окне
Bullish Rectangle
сформирован 23.04 в 16:30:47 (UTC+0)
сила сигнала 1 из 5
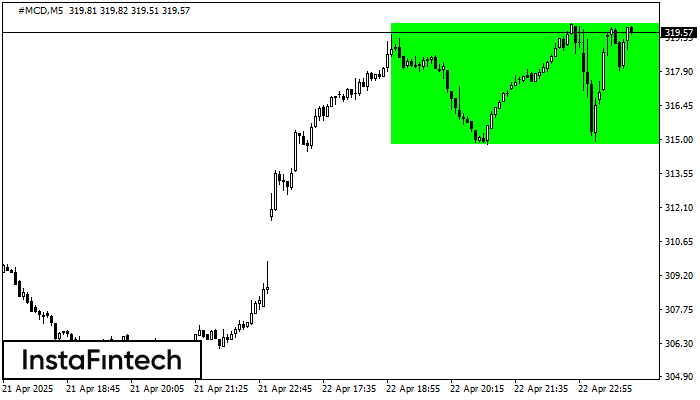
According to the chart of M5, #MCD formed the Bullish Rectangle. The pattern indicates a trend continuation. The upper border is 319.97, the lower border is 314.80. The signal means
The M5 and M15 time frames may have more false entry points.
Открыть график инструмента в новом окне


