অ্যাকচুয়াল প্যাটার্নস

প্যাটার্ন হলো গ্রাফিক্যাল মডেল, যা মূল্য ওঠানামার ভিত্তিতে চার্টে তৈরি হয়। টেকনিক্যাল বিশ্লেষণের নীতি অনুযায়ী, ইতিহাসের (প্রাইস মুভমেন্ট) পুনরাবৃত্তি ঘটে। অর্থাৎ, পরিস্থিতি যদি একই রকম থাকে তাহলে প্রাইস মুভমেন্টও প্রায় একই রকম হয়। এর ফলে মূল্যের ওঠানামা কেমন হবে তা আগেই থেকেই অনুমান করা যায়।
ইন্সটাফরেক্স এর প্রাসঙ্গিক প্যাটার্নসমূহ সহজেই ব্যবহার করা যায়, যার মাধ্যমে মার্কেটের সর্বশেষ পরিস্থিতি জানা যায় এবং তার উপর ভিত্তি করে সিদ্ধান্ত নেওয়া যায়। আমাদের সেবাগুলো থেকে আপনি যেকোনো পেয়ার এবং টাইমফ্রেমের জন্য সর্বশেষ এবং সবচেয়ে প্রাসঙ্গিক প্যাটার্নগুলো খুঁজে পাবেন।
Bearish pennant
was formed on 27.03 at 20:32:55 (UTC+0)
signal strength 2 of 5
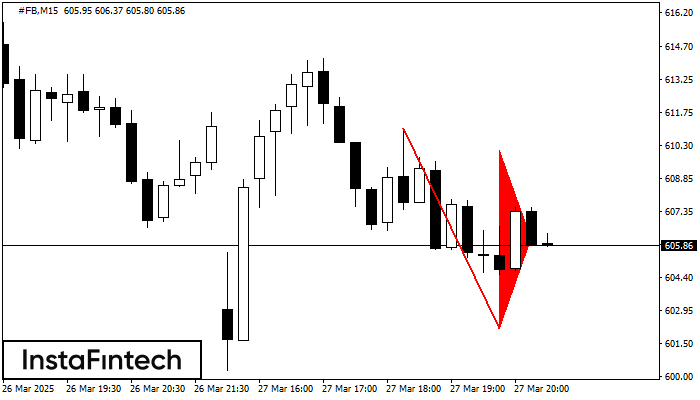
The Bearish pennant pattern has formed on the #FB M15 chart. It signals potential continuation of the existing trend. Specifications: the pattern’s bottom has the coordinate of 602.15; the projection of the flagpole height is equal to 891 pips. In case the price breaks out the pattern’s bottom of 602.15, the downtrend is expected to continue for further level 601.92.
The M5 and M15 time frames may have more false entry points.
- All
- All
- Bearish Rectangle
- Bearish Symmetrical Triangle
- Bearish Symmetrical Triangle
- Bullish Rectangle
- Double Top
- Double Top
- Triple Bottom
- Triple Bottom
- Triple Top
- Triple Top
- All
- All
- Buy
- Sale
- All
- 1
- 2
- 3
- 4
- 5
হেড অ্যান্ড শোল্ডার্স
was formed on 09.04 at 03:35:15 (UTC+0)
signal strength 1 of 5
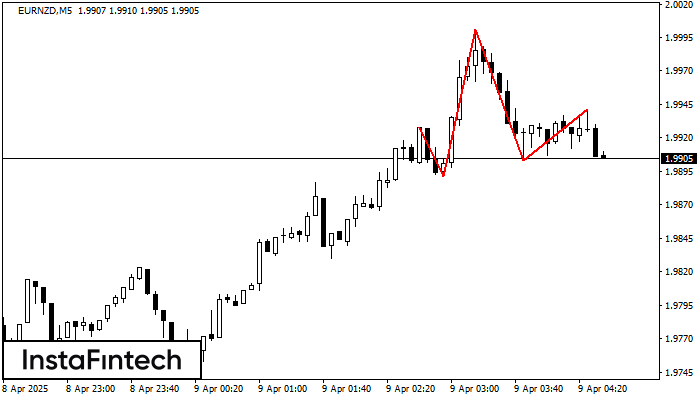
M5 চার্টে, EURNZD-এর হেড অ্যান্ড শোল্ডার্স টেকনিক্যাল প্যাটার্ন গঠিত হয়েছে৷ ডান দিকের শোল্ডার গঠন হওয়ার পরে মূল্য 1.9891/1.9903-এর নেকলাইনকে ছাড়িয়ে যাবে বলে পরামর্শ দেওয়ার বেশ কিছু কারণ রয়েছে৷ সুতরাং, মূল্য
M5 এবং M15 টাইম ফ্রেমে আরও ভুল এন্ট্রি পয়েন্ট থাকতে পারে।
Open chart in a new window
বুলিশ রেক্ট্যাঙ্গেল
was formed on 09.04 at 02:09:41 (UTC+0)
signal strength 3 of 5
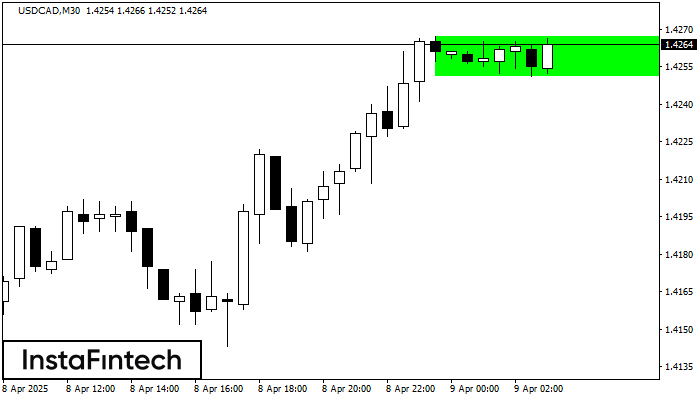
M30 চার্ট অনুযায়ী, USDCAD বুলিশ রেক্ট্যাঙ্গেল গঠন করেছে। এই প্যাটার্ন চলমান প্রবণতার ধারাবাহিকতা নির্দেশ করে। উপরের সীমানা হল 1.4267, নীচের সীমানা হল 1.4251৷ এই সংকেতের অর্থ হল বুলিশ রেক্ট্যাঙ্গেল -এর
Open chart in a new window
ডাবল টপ
was formed on 09.04 at 02:00:40 (UTC+0)
signal strength 3 of 5
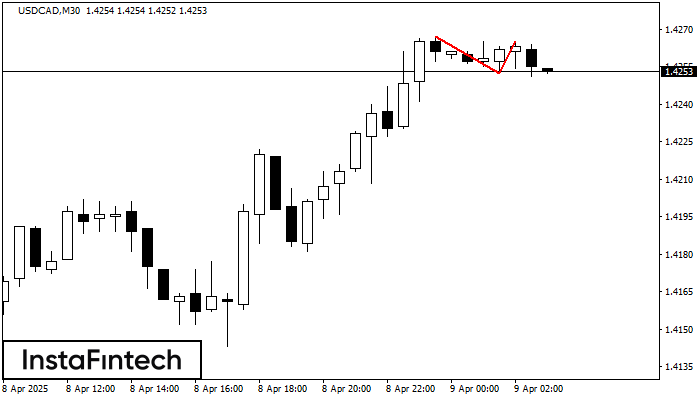
M30 চার্টে, USDCAD-এর ডাবল টপ প্যাটার্নটি গঠিত হয়েছে। এটি এই ইঙ্গিত দেয় যে চলমান প্রবণতা ঊর্ধ্বমুখী থেকে নিম্নমুখীতে পরিবর্তিত হয়েছে। সম্ভবত, যদি 1.4252 প্যাটার্নের ভিত্তিটি ব্রেক করা হয়, তাহলে নিম্নমুখী
Open chart in a new window