

অ্যাকচুয়াল প্যাটার্নস

প্যাটার্ন হলো গ্রাফিক্যাল মডেল, যা মূল্য ওঠানামার ভিত্তিতে চার্টে তৈরি হয়। টেকনিক্যাল বিশ্লেষণের নীতি অনুযায়ী, ইতিহাসের (প্রাইস মুভমেন্ট) পুনরাবৃত্তি ঘটে। অর্থাৎ, পরিস্থিতি যদি একই রকম থাকে তাহলে প্রাইস মুভমেন্টও প্রায় একই রকম হয়। এর ফলে মূল্যের ওঠানামা কেমন হবে তা আগেই থেকেই অনুমান করা যায়।
ইন্সটাফরেক্স এর প্রাসঙ্গিক প্যাটার্নসমূহ সহজেই ব্যবহার করা যায়, যার মাধ্যমে মার্কেটের সর্বশেষ পরিস্থিতি জানা যায় এবং তার উপর ভিত্তি করে সিদ্ধান্ত নেওয়া যায়। আমাদের সেবাগুলো থেকে আপনি যেকোনো পেয়ার এবং টাইমফ্রেমের জন্য সর্বশেষ এবং সবচেয়ে প্রাসঙ্গিক প্যাটার্নগুলো খুঁজে পাবেন।
Bullish Symmetrical Triangle
was formed on 21.03 at 22:36:29 (UTC+0)
signal strength 1 of 5

According to the chart of M5, USDCHF formed the Bullish Symmetrical Triangle pattern. The lower border of the pattern touches the coordinates 0.8825/0.8830 whereas the upper border goes across 0.8835/0.8830. If the Bullish Symmetrical Triangle pattern is in progress, this evidently signals a further upward trend. In other words, in case the scenario comes true, the price of USDCHF will breach the upper border to head for 0.8845.
The M5 and M15 time frames may have more false entry points.
আরও দেখুন
- All
- All
- Bearish Rectangle
- Bearish Symmetrical Triangle
- Bearish Symmetrical Triangle
- Bullish Rectangle
- Double Top
- Double Top
- Triple Bottom
- Triple Bottom
- Triple Top
- Triple Top
- All
- All
- Buy
- Sale
- All
- 1
- 2
- 3
- 4
- 5
Kepala dan bahu
was formed on 26.03 at 10:00:22 (UTC+0)
signal strength 1 of 5
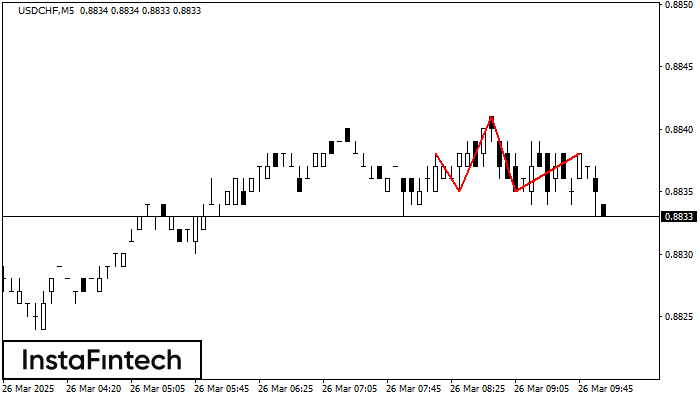
Menurut grafik M5, USDCHF membentuk pola Kepala dan bahu. Puncak The Head ditetapkan di 0.8841 sementara garis median the Neck ditemukan di 0.8835/0.8835. Formasi pola Kepala dan bahu terbukti mensinyalkan
Rangka waktu M5 dan M15 mungkin memiliki lebih dari titik entri yang keliru.
Open chart in a new window
Teratas Ganda
was formed on 26.03 at 09:45:05 (UTC+0)
signal strength 2 of 5
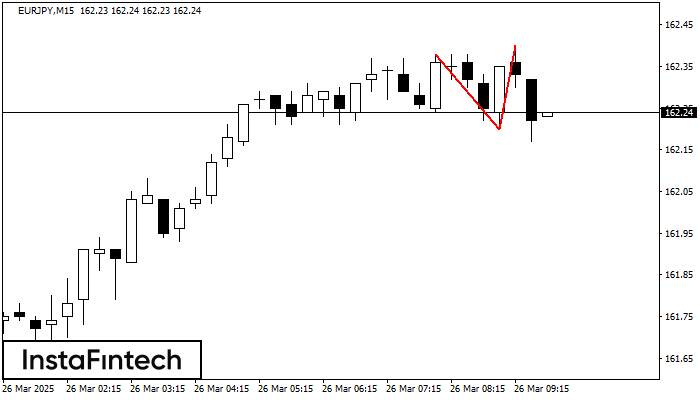
Pola reversal Teratas Ganda telah terbentuk pada EURJPY M15. Karakteristik: batas atas 162.38; batas bawah 162.20; lebar pola 20 poin. Transaksi jual lebih baik dibuka di bawah batas bawah 162.20
Rangka waktu M5 dan M15 mungkin memiliki lebih dari titik entri yang keliru.
Open chart in a new window
Segitiga Simetris Bullish
was formed on 26.03 at 09:45:02 (UTC+0)
signal strength 1 of 5
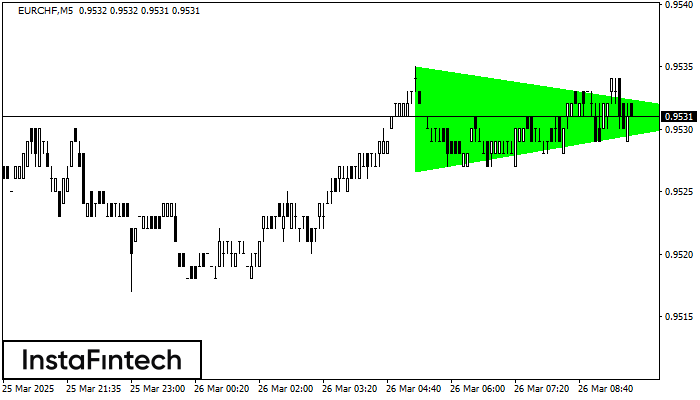
Menurut Grafik dari M5, EURCHF dibentuk pola Segitiga Simetris Bullish, yang menunjukkan tren akan berlanjut. Deksripsi. Batas atas dari pola menyentuh kordinat 0.9535/0.9531 dimana batas yang lebih rendah berada sepanjang
Rangka waktu M5 dan M15 mungkin memiliki lebih dari titik entri yang keliru.
Open chart in a new window


