النماذج الفعلية

النماذج هي نماذج رسومية تتشكل في الرسم البياني حسب السعر. وفقا لأحد المسلمات التحليلية الفنية، فإن التاريخ (حركة السعر) يكرر نفسه. ويعني ذلك أن حركات الأسعار غالباً ما تكون متشابهة في نفس الأوضاع مما يجعل من الممكن التنبؤ بزيادة تطوير الوضع الذي يتسم باحتمال كبير.
النماذج ذات الصلة المقدمة من قبل إنستافوركس هي خدمة سهلة الاستخدام تسمح لك بمعرفة التغييرات الأخيرة في السوق والرد على الأدلة من السوق في الوقت المناسب. في خدمتنا، ستجد دائمًا النماذج الأكثر حداثة وملاءمة في أي زوج وأي إطار زمني.
Triple Top
was formed on 02.04 at 16:00:28 (UTC+0)
signal strength 2 of 5
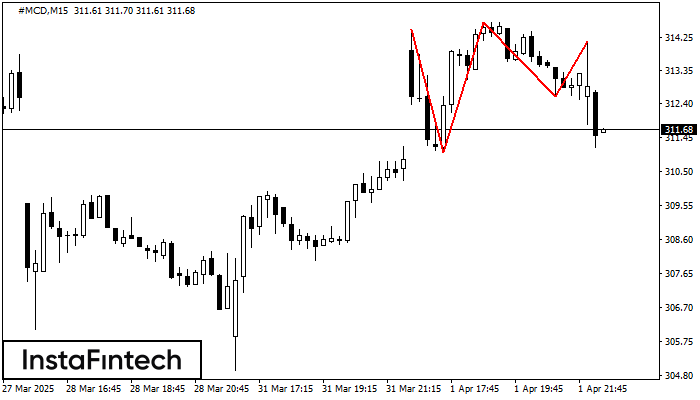
The Triple Top pattern has formed on the chart of the #MCD M15. Features of the pattern: borders have an ascending angle; the lower line of the pattern has the coordinates 311.03/312.60 with the upper limit 314.48/314.14; the projection of the width is 345 points. The formation of the Triple Top figure most likely indicates a change in the trend from upward to downward. This means that in the event of a breakdown of the support level of 311.03, the price is most likely to continue the downward movement.
The M5 and M15 time frames may have more false entry points.
- All
- All
- Bearish Rectangle
- Bearish Symmetrical Triangle
- Bearish Symmetrical Triangle
- Bullish Rectangle
- Double Top
- Double Top
- Triple Bottom
- Triple Bottom
- Triple Top
- Triple Top
- All
- All
- Buy
- Sale
- All
- 1
- 2
- 3
- 4
- 5
Triple Bottom
was formed on 25.04 at 11:55:08 (UTC+0)
signal strength 1 of 5
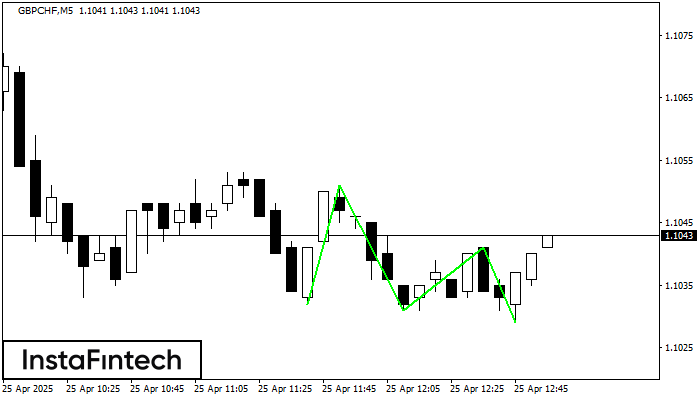
Corak Triple Bottom telah dibentuk pada GBPCHF M5. Ia mempunyai ciri-ciri berikut: tahap rintangan 1.1051/1.1041; tahap sokongan 1.1032/1.1029; lebar corak adalah 19 mata. Dalam situasi penembusan paras rintangan 1.1051, harga
Carta masa M5 dan M15 mungkin mempunyai lebih banyak titik kemasukan palsu.
Open chart in a new window
Double Top
was formed on 25.04 at 11:40:02 (UTC+0)
signal strength 1 of 5
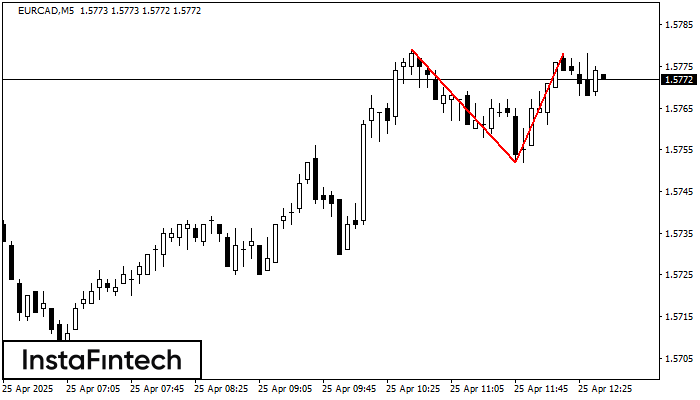
Pada carta EURCAD M5 corak pembalikan Double Top telah terbentuk. Ciri-ciri: sempadan atas 1.5778; sempadan bawah 1.5752; lebar corak 26 mata. Isyarat: penembusan sempadan bawah akan menyebabkan kesinambungan arah aliran
Carta masa M5 dan M15 mungkin mempunyai lebih banyak titik kemasukan palsu.
Open chart in a new window
Triple Bottom
was formed on 25.04 at 11:34:47 (UTC+0)
signal strength 1 of 5
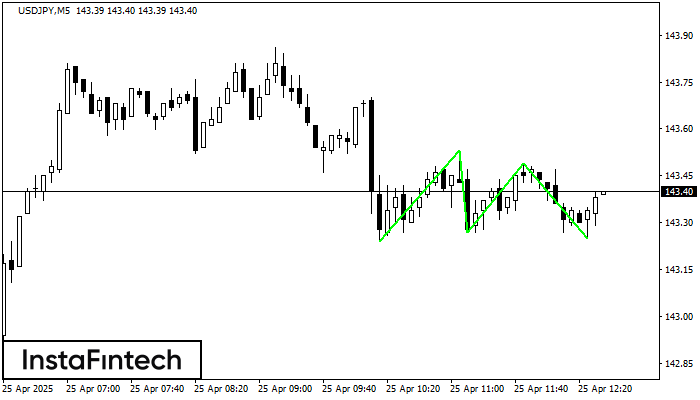
Corak Triple Bottom telah dibentuk pada USDJPY M5. Ia mempunyai ciri-ciri berikut: tahap rintangan 143.53/143.49; tahap sokongan 143.24/143.25; lebar corak adalah 29 mata. Dalam situasi penembusan paras rintangan 143.53, harga
Carta masa M5 dan M15 mungkin mempunyai lebih banyak titik kemasukan palsu.
Open chart in a new window