

النماذج الفعلية

النماذج هي نماذج رسومية تتشكل في الرسم البياني حسب السعر. وفقا لأحد المسلمات التحليلية الفنية، فإن التاريخ (حركة السعر) يكرر نفسه. ويعني ذلك أن حركات الأسعار غالباً ما تكون متشابهة في نفس الأوضاع مما يجعل من الممكن التنبؤ بزيادة تطوير الوضع الذي يتسم باحتمال كبير.
النماذج ذات الصلة المقدمة من قبل إنستافوركس هي خدمة سهلة الاستخدام تسمح لك بمعرفة التغييرات الأخيرة في السوق والرد على الأدلة من السوق في الوقت المناسب. في خدمتنا، ستجد دائمًا النماذج الأكثر حداثة وملاءمة في أي زوج وأي إطار زمني.
Double Bottom
was formed on 01.04 at 16:44:59 (UTC+0)
signal strength 2 of 5
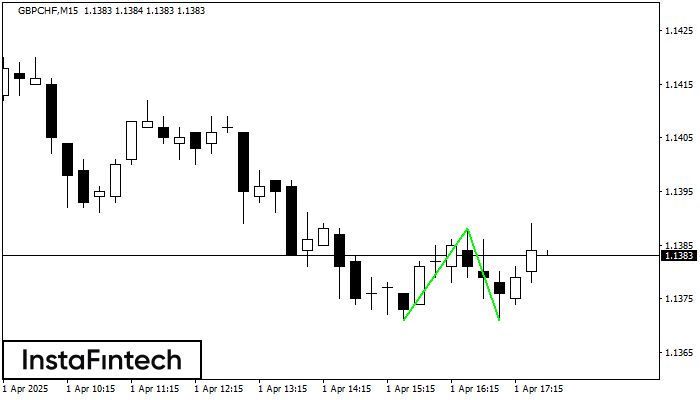
The Double Bottom pattern has been formed on GBPCHF M15. Characteristics: the support level 1.1371; the resistance level 1.1388; the width of the pattern 17 points. If the resistance level is broken, a change in the trend can be predicted with the first target point lying at the distance of 17 points.
The M5 and M15 time frames may have more false entry points.
- All
- All
- Bearish Rectangle
- Bearish Symmetrical Triangle
- Bearish Symmetrical Triangle
- Bullish Rectangle
- Double Top
- Double Top
- Triple Bottom
- Triple Bottom
- Triple Top
- Triple Top
- All
- All
- Buy
- Sale
- All
- 1
- 2
- 3
- 4
- 5
Retângulo de baixa
was formed on 14.04 at 05:44:19 (UTC+0)
signal strength 1 of 5
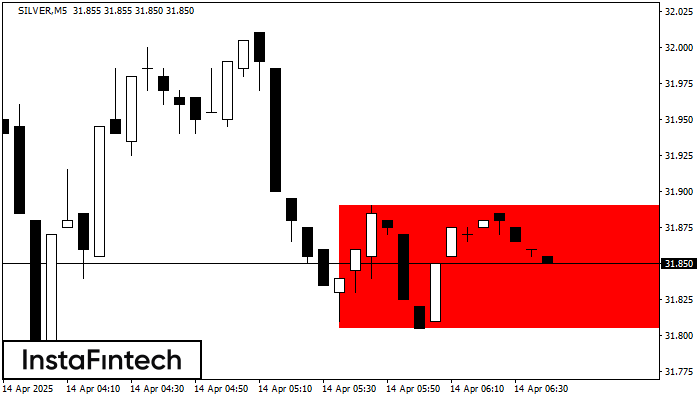
De acordo com o gráfico de M5, SILVER formou Retângulo de baixa que é um padrão de uma continuação de tendência. O padrão está dentro dos seguintes limites: limite inferior
Os intervalos M5 e M15 podem ter mais pontos de entrada falsos.
Open chart in a new window
Cabeça & Ombros
was formed on 14.04 at 05:15:40 (UTC+0)
signal strength 1 of 5

De acordo com o gráfico de M5, EURCAD formou o padrão Cabeça & Ombros. O topo da Cabeça está definido em 1.5811 enquanto a linha mediana do Pescoço é encontrada
Os intervalos M5 e M15 podem ter mais pontos de entrada falsos.
Open chart in a new window
Fundo duplo
was formed on 14.04 at 04:45:49 (UTC+0)
signal strength 1 of 5

O padrão Fundo duplo foi formado em NZDCAD M5. Esta formação sinaliza uma reversão da tendência de baixo para cima. O sinal é que uma negociação de compra deve
Os intervalos M5 e M15 podem ter mais pontos de entrada falsos.
Open chart in a new window


